Fig. 11
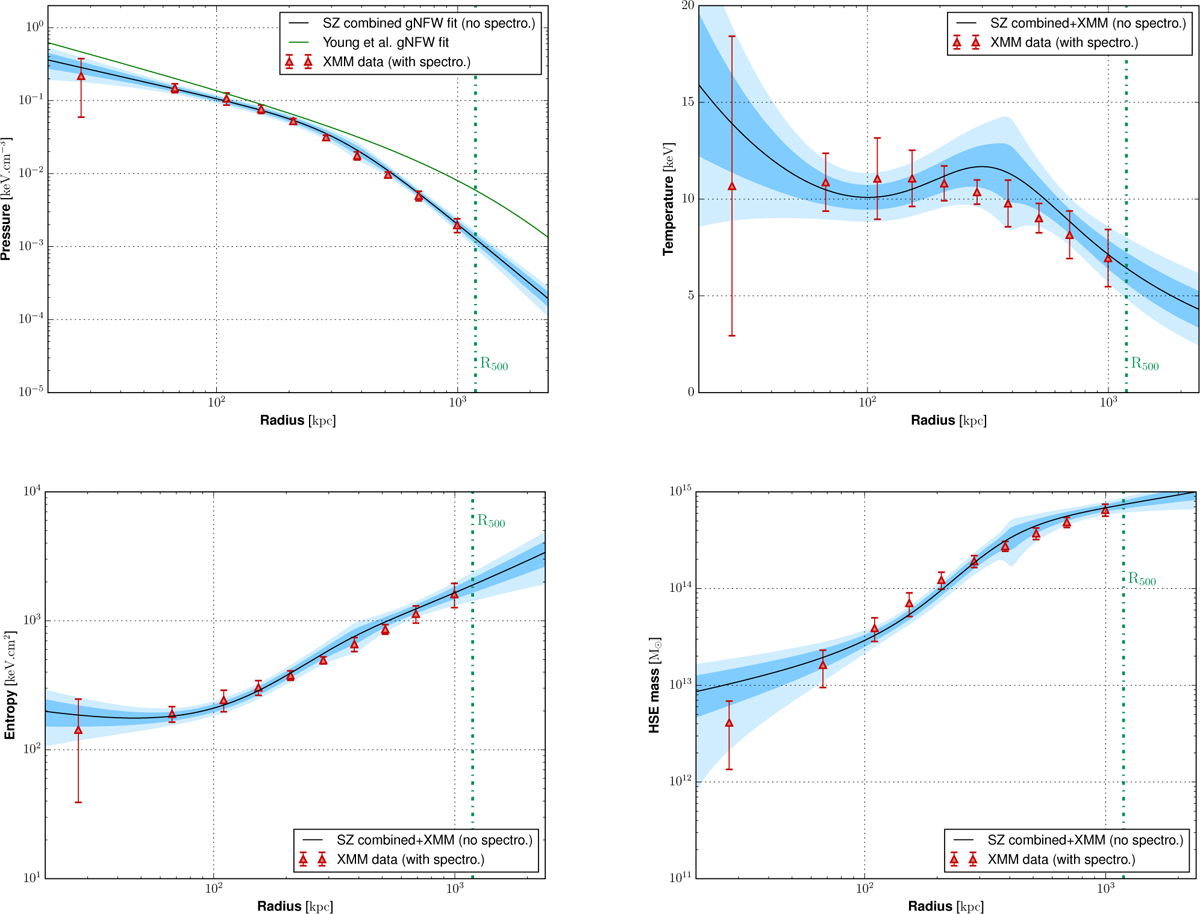
Constraints on the deprojected radial profiles of the pressure (top left), temperature (top right), entropy (bottom left), and hydrostatic mass (bottom right) obtained from the MCMC analysis masking the over-pressure region. The tSZ pressure profile corresponds to the best-fit gNFW model of the non-parametric pressure profile constrained from the analysis masking the over-pressure region. The pressure profile from Young et al. (2015) is also shown in green. The XMM-Newton measurements are indicated with red triangles. The dark and light blue regions show the 68% and 95% confidence region on the ICM thermodynamic radial profiles estimated with this multi-probe analysis. The best fit is indicated bythe black line.
Current usage metrics show cumulative count of Article Views (full-text article views including HTML views, PDF and ePub downloads, according to the available data) and Abstracts Views on Vision4Press platform.
Data correspond to usage on the plateform after 2015. The current usage metrics is available 48-96 hours after online publication and is updated daily on week days.
Initial download of the metrics may take a while.