Fig. 7
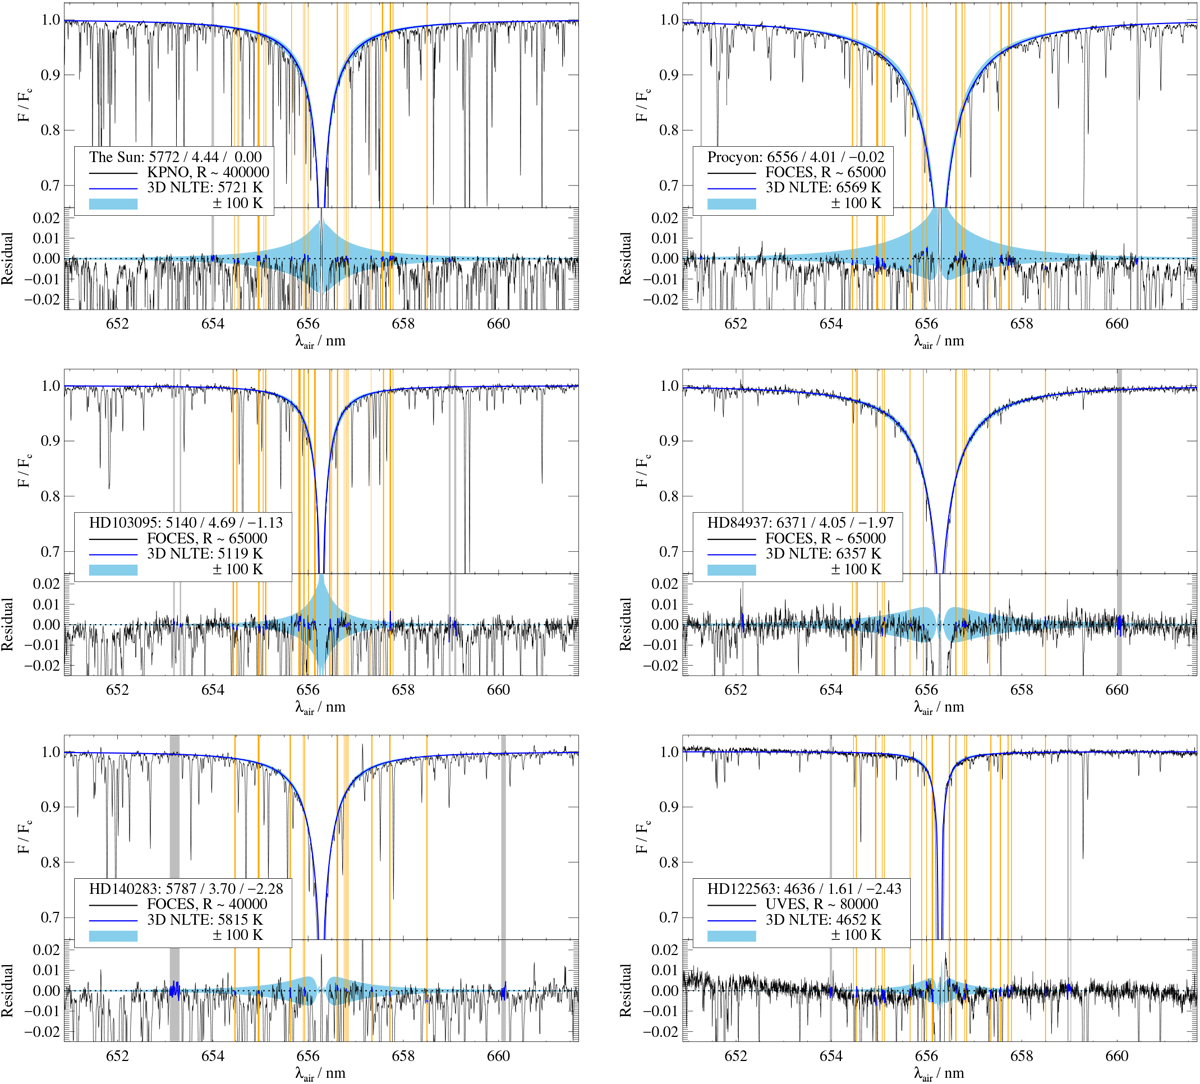
Hα line profiles observed in benchmark stars, compared to the best-fitting 3D non-LTE model when effective temperature is taken as a free parameter. The reference parameters Teff / logg/![]() of each star are given in the legends. The continuum and line masks are shown as dark and light vertical bands, respectively. The light shaded region indicates the effect of adjusting the effective temperature by ± 100 K, where lower effective temperatures result in a weaker line and thus a higher normalised flux. Residuals between the 3D non-LTE model and the observations are shown in the lower panel. Residuals inside the masks are highlighted using thick lines; only these pixels have any influence on the fitting procedure.
of each star are given in the legends. The continuum and line masks are shown as dark and light vertical bands, respectively. The light shaded region indicates the effect of adjusting the effective temperature by ± 100 K, where lower effective temperatures result in a weaker line and thus a higher normalised flux. Residuals between the 3D non-LTE model and the observations are shown in the lower panel. Residuals inside the masks are highlighted using thick lines; only these pixels have any influence on the fitting procedure.
Current usage metrics show cumulative count of Article Views (full-text article views including HTML views, PDF and ePub downloads, according to the available data) and Abstracts Views on Vision4Press platform.
Data correspond to usage on the plateform after 2015. The current usage metrics is available 48-96 hours after online publication and is updated daily on week days.
Initial download of the metrics may take a while.