Fig. 2
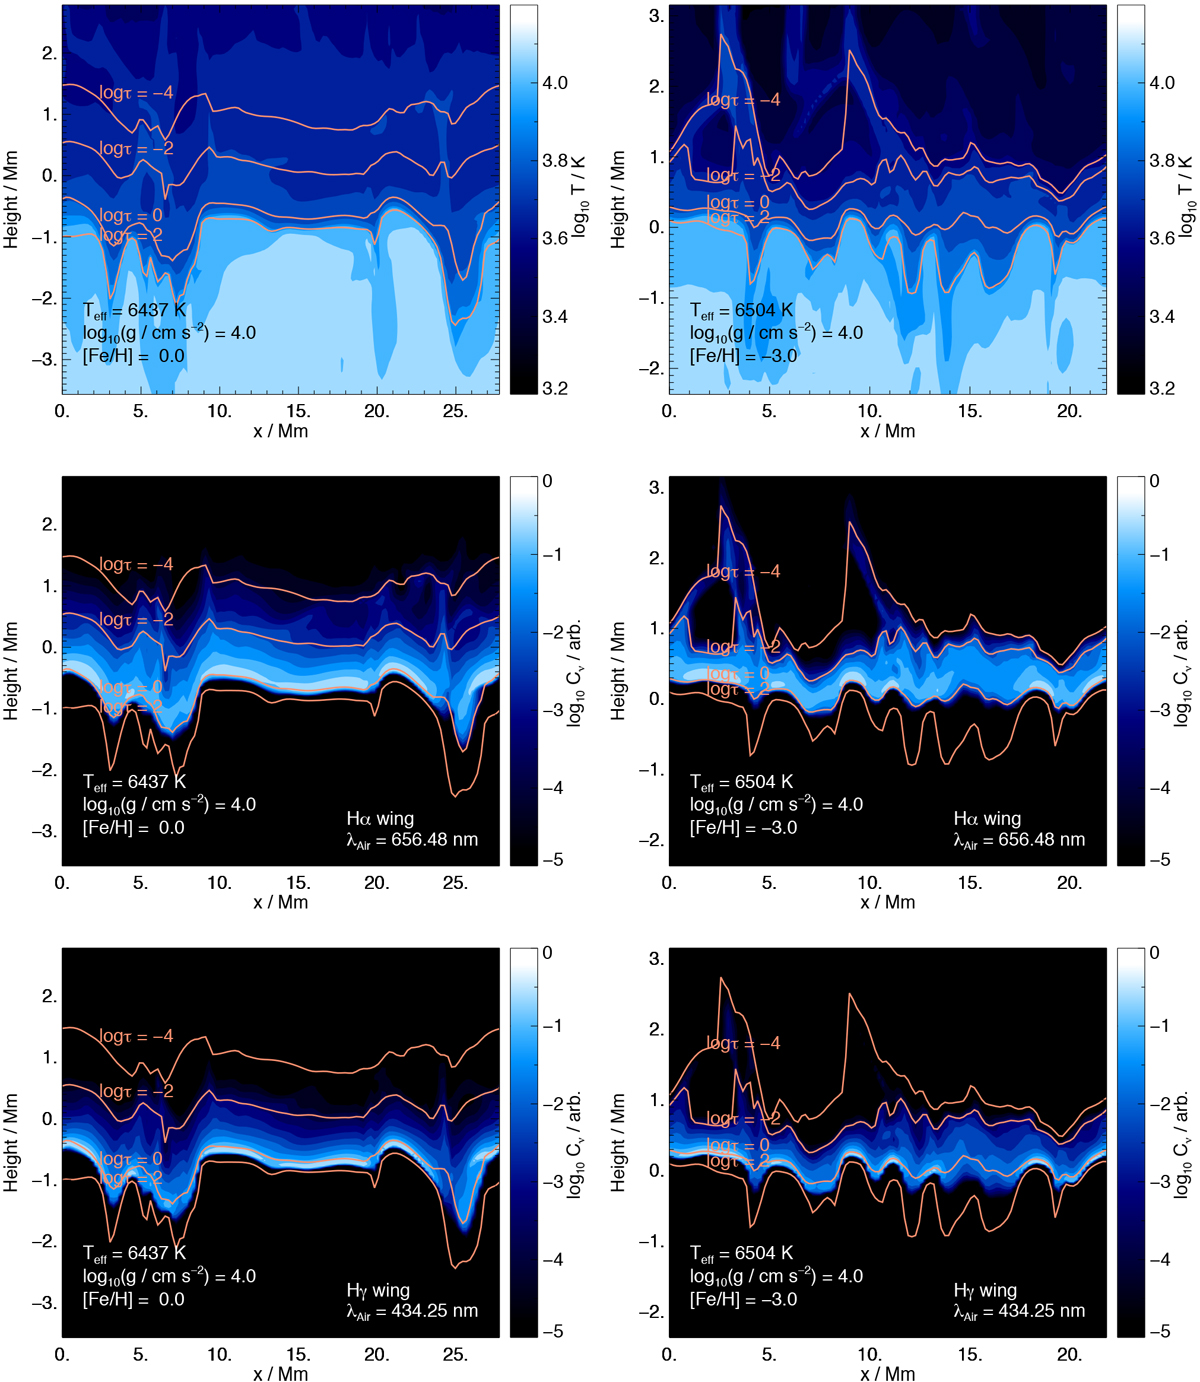
Gas temperatures T (first row) and contribution functions Cν for the inner wings (0.2 nm redward of the line centre) of the Hα (second row) and Hγ (third row) lines, in vertical slices of the solar metallicity (left column) and metal-poor (right column) model atmospheres shown in Fig. 1. Lighter shading indicates larger temperatures (first row), and more emergent flux contribution (second and third rows). Contours of constant log τR are overdrawn. In each plot, the contribution functions are normalised such that their maximum values are unity.
Current usage metrics show cumulative count of Article Views (full-text article views including HTML views, PDF and ePub downloads, according to the available data) and Abstracts Views on Vision4Press platform.
Data correspond to usage on the plateform after 2015. The current usage metrics is available 48-96 hours after online publication and is updated daily on week days.
Initial download of the metrics may take a while.