Fig. 7
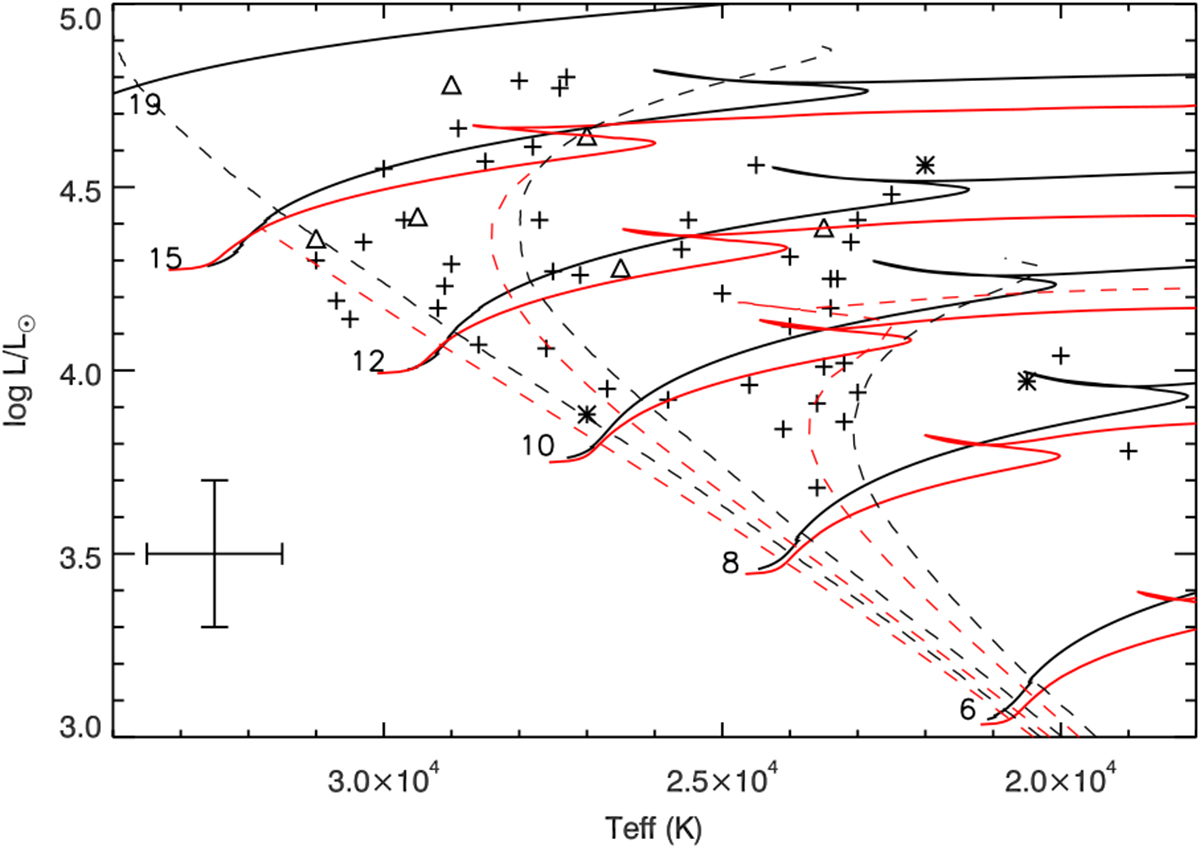
Observed luminosities for the VFTS sample as a function of effective temperature. Targets with an estimated nitrogen abundance, 7.2 ≤ϵN < 7.5 dex, are shown as asterisks and those with ϵN ≥ 7.5 dex are shown as triangles; all other targets are shown as crosses. Evolutionary tracks and isochrones (see caption to Fig. 3) are also shown, together with typical uncertainties in the effective temperatures and luminosity estimates.
Current usage metrics show cumulative count of Article Views (full-text article views including HTML views, PDF and ePub downloads, according to the available data) and Abstracts Views on Vision4Press platform.
Data correspond to usage on the plateform after 2015. The current usage metrics is available 48-96 hours after online publication and is updated daily on week days.
Initial download of the metrics may take a while.