Free Access
Fig. 1
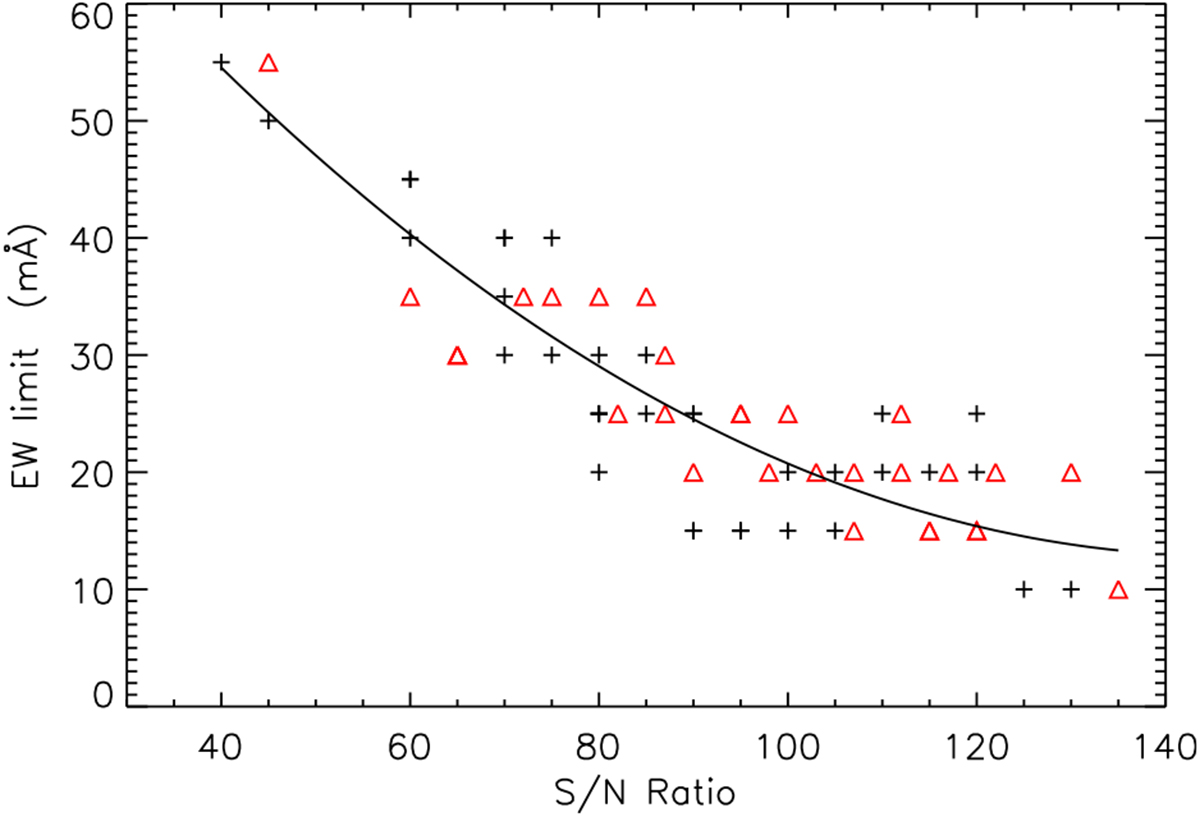
Estimated equivalent width limits (in mÅ) plotted against the S/N of the VFTS spectra. Crosses and triangles represent stars with ve sini ≤ 40 km s−1 and 40 <ve sini ≤ 80 km s−1 respectively. A quadratic linear least squares fit for all the estimates is also shown.
Current usage metrics show cumulative count of Article Views (full-text article views including HTML views, PDF and ePub downloads, according to the available data) and Abstracts Views on Vision4Press platform.
Data correspond to usage on the plateform after 2015. The current usage metrics is available 48-96 hours after online publication and is updated daily on week days.
Initial download of the metrics may take a while.