| Issue |
A&A
Volume 615, July 2018
|
|
|---|---|---|
| Article Number | A73 | |
| Number of page(s) | 10 | |
| Section | Stellar structure and evolution | |
| DOI | https://doi.org/10.1051/0004-6361/201732408 | |
| Published online | 17 July 2018 | |
A new X-ray look into four old pulsars
1
INAF,
Istituto di Astrofisica Spaziale e Fisica Cosmica Milano,
via E. Bassini 15,
20133
Milano,
Italy
2
Dipartimento di Fisica G. Occhialini, Università degli Studi di Milano Bicocca,
Piazza della Scienza 3,
20126
Milano,
Italy
e-mail: This email address is being protected from spambots. You need JavaScript enabled to view it.
Received:
4
December
2017
Accepted:
26
February
2018
Abstract
We report on the X-ray properties of four rotation-powered pulsars with characteristic ages in the range 0.3–5 Myr, derived from the analysis of XMM–Newton archival observations. We found convincing evidence of thermal emission only in the phase-averaged spectrum of PSR B0114+58, which is well fitted by a blackbody with temperature kT = 0.17 ± 0.02 keV and emitting radius R = 405+110−90 m, consistent with the size of its polar cap. The three other considered pulsars, PSR B0628−28, PSR B0919+06, and PSR B1133+16, have phase-averaged spectra that can be described well by single power laws with photon index Γ ~ 3. The 3σ upper limits on the bolometric luminosity of a possible thermal component with temperatures in the range ~0.05−2 keV are Lbol ≲ 3.2 × 1028 erg s−1 and Lbol ≲ 2.4 × 1029 erg s−1, for PSR B0628−28 and PSR B0919+06, respectively. On the other hand, we found possible evidence that the pulsed emission of PSR B0628−28 is thermal. Two absorption lines at ~0.22 keV and ~0.44 keV are detected in the spectrum of PSR B1133+16. They are best interpreted as proton cyclotron features, implying the presence of multipolar components with a field of a few 1013 G at the neutron star polar caps. We discuss our results in the context of high-energy emission models of old rotation-powered pulsars.
Key words: pulsars: general / stars: neutron / pulsars: individual: PSR B0628−28 / pulsars: individual: PSR B0919+06 / pulsars: individual: PSR B0114+58 / pulsars: individual: PSR B1133+16
© ESO 2018
1 Introduction
X-rays have been detected from more than one hundred rotation-powered pulsars. The properties of the X-ray emission, and in particular the relative strength of the non-thermal and thermal spectral components, depend on the pulsar’s age (Becker 2009; Harding 2013).
Young pulsars have the highest surface temperatures, but their thermal flux is unobservable; they are outshined by a much stronger non-thermal emission, which fades as the pulsars age and slow down, thus unmasking the underlying thermal emission of the neutron star (NS) surface.
Middle-aged pulsars show a mix of non-thermal and thermal X-ray emission. The latter is often modelled with two blackbody components. The cooler components have emitting areas consistent with emission from the whole NS surface and temperatures in agreement with the prediction of standard cooling theories. The hotter components have blackbody temperatures typically in the range 0.1–0.3 keV and emitting radii between a few tens and a few hundred metres, implying that the X-rays come from a small region of the NS (i.e. PSR B0656+14, PSR J0633+1746, PSR B1055−52 (De Luca et al. 2005) and PSR J1740+1000; Kargaltsev et al. 2012).
X-rays have been detected also in older pulsars, that have cooled down to temperatures too low to significantly emit in the X-ray band. In these objects both non-thermal X-rays of magnetospheric origin and/or emission from hot polar caps have been observed with high confidence only in a few objects (see for example PSR B1929+10; Misanovic et al. 2008). In fact, most old pulsars are rather faint X-ray sources and their study can benefit of the use of maximum likelihood (ML) techniques, as demonstrated for PSR B0943+10 (Hermsen et al. 2013; Mereghetti et al. 2016) and PSR B1822−09 (Hermsen et al. 2017).
Here, we report a reanalysis of XMM–Newton archival data of four pulsars with characteristic ages in the range 0.3− 5 Myr based on ML methods. The main properties of our targets are summarized in Table 1.
Pulsar properties.
2 Observations and data reduction
We used the data obtained with the pn (Strüder et al. 2001) and the two MOS (Turner et al. 2001) cameras, which constitute the European Photon Imaging Cameras (EPIC) instrument on board XMM–Newton and cover the energy range 0.2–12 keV.
The medium optical filter was used for PSR B0114+58 and for the MOS cameras data of PSR B0628−28. All the other data were obtained using the thin filter. The time resolution of the different operating modes used during our observations are indicated in Table 2. We note that while the pn time resolution was adequate to reveal the pulsations in all our targets, this is not true for the MOS data, except in the case of PSR B1133+16. The data reduction and analysis were done using version 15 of the Science Analysis System (SAS)1 and XSPEC(ver. 12.8.2) for the spectral fits.
We reprocessed the pn data using the SAS task epreject to reduce the detector noise at the lowest energies. We then removed the time intervals of high background by rejecting all the periods with a pn count rate higher than 1.0 cts s−1 in the range 10–12 keV. The resulting net exposure times for each pulsar are indicated in Table 2.
We used single- and multiple-pixel events for both the pn and MOS. The events detected in the two MOS were combined into a single data set, and in their analysis we used averaged exposure maps and response files.
We applied a maximum likelihood (ML) analysis to extract the net (i.e. background-subtracted) source counts used for the spectral andtiming analysis. The resulting count spectra were put in a format compatible with analysis in XSPEC. By exploiting the knowledge of the instrumental point spread function (PSF), this method provides spectra and light curves with a number of source counts larger than what is typically obtained with the traditional method based on “source” and “background” extraction regions. Another advantage is that the background is directly measured at the position of the source, contrary to what is done with the traditional analysis in which it is estimated from “source free” regions of the image.
The ML method measures the source counts taking into account all the events of the region of interest. Specifically, it finds the source flux and background level which maximize the probability of obtaining the number of total counts Nij measured in each spatial pixel. The values of Nij follow a Poisson probability distribution, with expectation value μij = β + σ ×PSFij, where β is the background level, which we assumed to be uniform; σ is the number of source counts; and PSFij gives the relative contribution of the source flux in the pixel (i, j) taking into account the instrumental PSF, which depends on the position in the field of view and on the energy of the event. We used spatial pixels of 1 × 1 arcsec2 and we analysed separately the data of the pn and of the sum of the two MOS, adopting the respective PSFs, derived from in-flight calibrations2, with parameters appropriate for the average energy value in the considered bin.
Following Hermsen et al. (2017), we generalized the above method to also take into account the pulse phase information of the events. In this 3D-ML approach, the events are binned in spatial and phase coordinates and the expectation value of bin (i, j, k) is μijk = β + σu ×PSFij + σp ×PSFij ×Φk.
Now σu and σp represent the source counts for the unpulsed and pulsed components, while Φk is the normalized pulse profile at phase bin k. With this approach, and assuming a sinusoidal pulse (consistent with the data of our targets), we could simultaneously derive the fluxes (and spectra) for the unpulsed and the pulsed components. We define the pulsed fraction as the ratio of the pulsed to the total counts, σp ∕(σp + σu).
Journal of XMM–Newton observations.
3 Results
3.1 PSR B0628−28 (J0630−2834)
We applied the ML analysis to a circular region of radius 60″ centred at RA = 06h30m51s.01, Dec = −28°35′06. ″8. In the energy range 0.3–10 keV, this yielded 1021 ± 40 source counts in the pn and 527 ± 28 in the MOS, corresponding to a total count rate of (4.0 ± 0.1) × 10−2 cts s−1.
The spectral analysis was carried out in 20 energy bins for the pn and in 13 for the MOS. The two spectra were fitted simultaneously. Among single-component models, an absorbed power law gave the best fit with 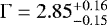 and NH
 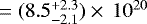 cm−2 (
 for 30 degrees of freedom (-d.o.f.)). The error regions of the parameters are shown in Fig. 1a. A fit with a single blackbody was not acceptable (
 for 30 d.o.f.). The best fit power law spectrum, together with its residuals and those of the blackbody fit are shown in Fig. 2.
The best fit NH is within 1σ of the value of 1021 cm−2, derived from the pulsar dispersion measure with the usual assumption of a 10% ionization of the interstellar medium (He et al. 2013). Fixing NH to this value, we get tighter constraints on the photon index, Γ = 2.95 ± 0.06. The corresponding unabsorbed flux in the 0.2–10 keV energy range is f0.2−10 = (1.08 ± 0.05) × 10−13 erg s−1 cm−2.
All the above results are in agreement with those of standard spectral analysis of the same data. Becker et al. (2005) in fact found a power law with photon index 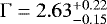 , while Tepedelenlioǧlu & Ögelman (2005), simultaneously fitting the XMM–Newton and Chandra spectra, obtained
  (1σ errors in both cases). These authors also considered a power law plus blackbody model, obtaining acceptable fits with slightly harder power laws and blackbody temperatures kT ~ 0.3 keV.
Using a power law plus blackbody model we found that several combinations of blackbody temperature and normalization, which give only a limited flux contribution, are consistent with the data. The best fit parameters were Γ = 2.92 ± 0.07 and kT ~ 0.02 keV, while the emitting radius is poorly constrained. However, the addition of a blackbody is not statistically required. Therefore, we derived an upper limit on its intensity as follows. We fitted the spectrum with a power law plus a blackbody model (NH fixed to 1021 cm−2) and computed the 3σ confidence ranges of the blackbody normalization and temperature, leaving the power law parameters free to vary. The results are shown in Fig. 3; the upper panel refers to the emitting radius and the lower panel to the bolometric luminosity. The latter has been computed as Lbol = πR2σT4 because we are considering emission from a hot spot on the stellar surface.
To investigate the spectral properties of the pulsed and unpulsed emission, we performed a 3D-ML analysis on the pn data in seven energy bins in the range 0.3 keV10 keV. The phases of the detected counts were computed using the period at the epoch of the XMM–Newton observation, P = 1.2444225976(2) s, obtained from the ephemeris reported in the online3 ATNF Pulsar Catalogue (Manchester et al. 2005). The pulsed fraction is higher in the 0.40–0.65 keV range, with an average value of 0.46 ± 0.05 and decreases at lower and higher energies (Fig. 4, left). The energy dependence of the pulsed fraction is also reflected in the different shape of the pulsed and unpulsed spectra (Fig. 4, right). The unpulsed spectrum is fitted well by a power law with the same slope as that of the total spectrum, while that of the pulsed emission requires a significantly steeper power law or a blackbody (Table 3).
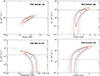 |
Fig. 1 Confidence regions (1, 2, and 3σ) of the best fit parameters for the spectra of (a) PSR B0628−28, (b) PSR B0919+06, (c) PSR B0114+58, and (d) PSR B1133+16. The best fit values are indicated by a plus and the DM-based value of NH by a dashed line. |
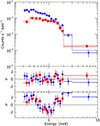 |
Fig. 2 EPIC-pn (blue diamonds) and -MOS (red squares) X-ray spectra of PSR B0628−28. The best fit power law is shown in the top panel, and the corresponding residuals in the middle panel. The bottom panel shows the residuals obtained by fitting the spectra with an absorbed blackbody. |
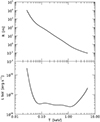 |
Fig. 3 Upper limits (3σ confidence level) on the blackbody component in PSR B0628−28 as a function of blackbody temperature. The top panel gives the limits on the emitting radius, while the lower panel gives the corresponding limits on the bolometric luminosity computed as Lbol =πR2σT4. |
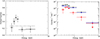 |
Fig. 4 Left: pulsed fraction of PSR B0628−28 as a function of energy obtained with the 3D-ML analysis. Right: EPIC-pn total (black circles), unpulsed (blue diamonds), and pulsed (red squares) spectra of PSR B0628−28. |
Spectral parameters of PSR B0628−28.
3.2 PSR B0919+06 (J0922+0638)
The faint X-ray counterpart of PSR B0919+06 was first reported by Prinz & Becker (2015). Based on a spectrum with 171 ± 18 counts, they rejected the blackbody model and found a good power law fit with  . Our ML analysis of the same data was carried out in circular region with radius of 45″ centred at RA = 09h22m14s.20, Dec = +06°38′33. ″7. In the energy range 0.2–10 keV we obtained 223 ± 25 (pn) and 91 ± 15 (MOS) source counts, corresponding to a total count rate of (1.3 ± 0.1) × 10−2 cts s−1.
We simultaneously fitted the pn (eight energy bins) and the MOS (seven energy bins) spectra. The single-component model that best fits the data is an absorbed power law (see Fig. 1b and Table 4). The single blackbody model is statistically unacceptable ( for 12 d.o.f.). We show the comparison between the power law and the blackbody best fits in Fig. 5. Fixing the absorption to the DM-based value 8 × 1020 cm−2, we obtain Γ =3.1 ± 0.2 and an unabsorbed flux f0.2−10 = (3.0 ± 0.4) × 10−14 erg s−1 cm−2.
Although a good fit is also obtained with a power law plus blackbody (Table 4), the addition of a blackbody is not statistically required. Therefore, as we did for PSR B0628−28, we derived the upper limits on its intensity as a function of T, which is shown in Fig. 6.
Spectral parameters of PSR B0919+06.
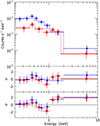 |
Fig. 5 EPIC-pn (blue diamonds) and -MOS (red squares) X-ray spectra of PSR B0919+06. The best fit power law is shown in the top panel, and the corresponding residuals in the middle panel. The bottom panel shows the residuals obtained by fitting the spectra with an absorbed blackbody. |
3.3 PSR B0114+58 (J0117+5914)
This faint pulsar, observed with XMM–Newton for less than 6 ks, is the one with the smallest number of counts in our sample. Prinz & Becker (2015) obtained a poorly constrained spectrum, which could be fitted equally well by a power law with Γ =3.3 ± 0.5 or by a blackbody with temperature kT = 0.18 ± 0.03 keV and emitting radius R = 322 ± 161 m (for d = 1.77 kpc).
We applied the ML analysis in a circular region centred at RA = 01h17m38s.24, Dec = +59°15′07. ″8 with a radius of 60″, from which we excluded a circle centred in RA = 01h17m34s.87, Dec = +59°15′15. ″4 with a radius of 20″ to avoid a nearby source. This resulted in 85 ± 13 pn counts and 44 ± 9 MOS counts in the range 0.2–10 keV, corresponding to a total count rate of (2.2 ± 0.3) × 10−2 cts s−1.
Simultaneously fitting the pn and the MOS spectra it was impossible to discriminate between a power law ( for 7 d.o.f.) and a blackbody (
 for 7 d.o.f.). However, restricting the analysis only to the pn spectrum, which is of better statistical quality, and fixing the absorption to the DM-based value of 1.5 × 1021 cm−2, we found that the blackbody is preferred (
 for 4 d.o.f., compared to
  for the power law). The best fit temperature is kT = 0.17 ± 0.02 keV, the radius of the emitting area is
  m, and the 0.2–10 keV unabsorbed flux is f0.2−10 = (4.7 ± 0.7) × 10−14 erg s−1 cm−2 (see Table 5 and Fig. 1c). Leaving the absorption free to vary, the power law is also acceptable, but with an unphysical photon index
  .
.
Spectral parameters of PSR B0114+58.
3.4 PSR B1133+16 (J1136+1551)
PSR B1133+16 has both optical (Zharikov et al. 2008; Zharikov & Mignani 2013) and X-ray (Kargaltsev et al. 2006) counterparts. According to these works, its X-ray spectrum can be described by either a power law or a blackbody (or a combination), but the statistics are too poor to distinguish between these models.
PSR B1133+16 was observed with five separate pointings over a time of about one month. With a simultaneous fit of the separate spectra, Szary et al. (2017) found a power law with Γ ≈ 2.5 and reported that the addition of a blackbody with  keV and a radius of
  m (for d = 350 pc) is also consistent with the data.
We verified that the analysis of the single observations gave fully consistent results. Therefore, we report only those obtained by combining the five pointings to extract a single pn and a single MOS spectrum. We applied the ML analysis in a circular region of radius 35″ and centred at RA = 11h36m02s.527, Dec = 15°50′59. ″90. We detected the source with a count rate of (1.06 ± 0.05) × 10−2 cts s−1 in the energy range 0.2–10 keV. For the spectral analysis the 887 ± 46 pn and 363 ± 29 MOS counts were divided into 19 and 11 energy bins, respectively.
The pn and the MOS spectra were fitted simultaneously. We could not obtain acceptable fits with a single power law or blackbody, or any combination of the two (including a power law plus two blackbodies) because in all cases significant residuals were presentbelow 0.5 keV. It is very unlikely that this was due to an instrumental or calibration problem because the spectra of two nearby soft and very bright sources do not show similar features.
Excluding the energy channels below 0.5 keV, we were able to obtain a good fit with an absorbed power law with photon index Γ =3.2 ± 0.4 and NH  cm−2 (Fig. 1d). With NH fixed to the DM-based value of 1.5 × 1020 cm−2 we obtained a photon index of 2.8 ± 0.1 (
 , for 18 d.o.f.). A blackbody fit was rejected (
 both for free and fixed NH).
A power law fit of the pn spectrum over the whole energy range suggests the presence of two absorption lines at ~ 0.2 keV and ~0.44 keV. We therefore fitted it with a model consisting of a power law with NH fixed to 1.5 × 1020 cm−2 and two Gaussian absorption lines. We constrained the lines to be centred at E2 = 2 × E1 and to have the same width σ1 = σ2. This model gave a good fit with E1 = 0.222 ± 0.006 keV and  keV (
keV ( for 13 d.o.f.). The best fit photon index is 2.9 ± 0.2, in good agreement with that found in the hardest part of the spectrum. The strength of the lines are poorly constrained, but they are 3σ above the 0 level (see Fig. 7). The best fit spectrum, together with its residuals and those of the single power law fit are shown in Fig. 8.
A good fit was also obtained with a power law plus blackbody with an absorption line at ~ 0.45 keV ( for 11 d.o.f.). However, the NH
  cm−2 is much higher than expected, the power law is quite steep (
 ), and the blackbody has kT = 0.045 ± 0.010 keV and a poorly constrained radius (1 < R < 70 km). This is compatible with emission from the cooling of the whole surface, but for an old pulsar such as PSR B1133+16 we would expect a lower temperature unless some reheating mechanism is operating.
To assess the statistical significance of the lines we estimated the probability of obtaining by chance a fit improvement like the observed one through Monte Carlo simulations. We simulated pn spectra of PSR B1133+16 with the same exposure time as in our observations using a model without lines, i.e. the best fit power law model with Γ = 2.36 (Table 6). We fitted each simulated spectrum with a single power law and with a power law plus two harmonically spaced lines and computed the ratio of the corresponding χ2 values F =  /
/  . We found a probability of 8 × 10⁻⁴ of having a fit improvement better than that observed in the real data (i.e. F > 2.47), corresponding to a ~3.1σ significance of the lines.
For the 3D-ML spectral-timing analysis, the phases were computed using the period at the epoch of the XMM–Newton observation, P = 1.187916418694(5) s given by Szary et al. (2017). We found an average pulsed fraction of 0.29 ± 0.05, and no significant energy variation over the range 0.2–3 keV in the pn (see Fig. 9, left). A hint of pulsation was also found in the MOS, with a pulsed fraction of 0.25 ± 0.07 in the range0.2–3 keV, but it was not possible to extract the 3D spectra. The pn spectra of the total, pulsed, and unpulsed flux are plotted in Fig. 9 (right). The unpulsed spectrum cannot be fitted by a single power law ( for 5 d.o.f.), while it is fitted well by the same absorption features of the total model. On the contrary, the spectrum of the pulsed emission does not require the addition of the absorption lines, and a power law with
  satisfactorily fits the spectrum. All the results of the spectral fits are summarized in Table 6.
 |
Fig. 6 Upper limits (3σ confidence level) on the blackbody component in PSR B0919+06, as a function of blackbody temperature. The top panel gives the limits on the emitting radius, while the lower panel gives the corresponding limits on the bolometric luminosity computed as Lbol =πR2σT4. |
 |
Fig. 7 Confidence regions (1, 2, and 3σ) of the best fit line strength vs. width of the two absorption lines in the spectrum of PSR B1133+16 (dashed lines: E1 ~ 0.22 keV, solid lines: E2 ~ 0.44 keV). The best fit values are indicated by a black plus. |
 |
Fig. 8 EPIC-pn spectrum of PSR B1133+16. The top panel shows the best fit with an absorbed power law plus two absorption lines at E1 ~ 0.22 and E2 ~ 0.44 keV. The corresponding residuals are shown in the middle panel. The bottom panel shows the residuals obtained by the best fit with a single power law in the range 0.5–10 keV. |
Spectral parameters of PSR B1133+16.
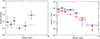 |
Fig. 9 Left: pulsed fraction of PSR B1133+16 as a function of energy obtained with the 3D-ML analysis. Right: EPIC-pn total (black circles), unpulsed (blue diamonds), and pulsed (red squares) spectra of PSR B1133+16. |
4 Discussion
Our ML analysis of the X-ray emission of four old rotation-powered pulsars has, in general, confirmed previous results, providing in some cases smaller uncertainties on the parameters and additional information on the spectral properties of these objects. Here, we first discuss the main results for the individual pulsars and then we put them in the broader context of the class of old rotation-powered pulsars.
In the case of PSR B0114+58, previous analysis could not distinguish between a thermal and a non-thermal spectrum (Prinz & Becker 2015), while we found that its emission is primarily thermal, being fitted well by a blackbody with kT = 0.17 ± 0.02 keV, emitting radius  m, and bolometric luminosity Lbol = (4.4 ± 3.0) × 1030 erg s−1. The small emitting area indicates that the thermal radiation comes from a hot spot on the stellar surface, most likely from the polar cap; in fact, the expected polar cap radius for PSR B0114+58 is
  m (for a NS radius of R* = 10 km).
We found no evidence of thermal components in the phase-averaged spectra of the other targets and derived 3σ upper limits on their bolometric luminosity of Lbol ≲ 3.2 × 1028 erg s−1 in PSR B0628−28 and Lbol ≲ 2.4 × 1029 erg s−1 in PSR B0919+06. These limits apply to temperatures in the range ~ 0.05–2 keV (see Figs. 3 and 6). However, the possible presence of a thermal component in PSR B0628−28 is suggested by the fact that its pulsed emission is softer than the unpulsed emission, and that it can be fitted by a blackbody with parameters consistent, within the errors, with the above-mentioned luminosity limit ( keV,
keV,  m).
m).
Finally, we found features below 0.5 keV with a statistical significance of ≳ 3σ in the spectrum of PSR B1133+16. This could be fitted either with a power law plus blackbody model and an absorption line at ~ 0.45 keV, or with a power law and two absorption lines at harmonically spaced energies E1 = 0.222 keV and E2 = 0.444 keV. The more realistic best fit parameters of the continuum component lead us to prefer the second interpretation. If the lowest energy line is an electron cyclotron feature, the implied magnetic field (Be = 1.9 × 10¹⁰(1 + z) G, where z is the gravitational redshift) is two orders of magnitude smaller than the surface field derived from the timing parameters of the pulsar (Bd = 2.1 × 10¹² G, under the usual dipole approximation). The electrons responsible for the feature should be high in the magnetosphere, and it is unclear how they could be confined in a small region with the appropriate magnetic field value. Alternatively, if the line is attributed to protons that could be in the atmosphere close to the NS surface, the required magnetic field is Bp = 3.5 × 10¹³(1 + z) G, implying the presence of multipolar field components, as required for example in the Partially Screened Gap model (Gil et al. 2003, 2007).
4.1 Thermal X-rays from hot polar caps
In Table 7, we list the information on the non-recycled rotation-powered pulsars with evidence of thermal emission from a small region of their surface. In addition to the objects where the presence of such emission is well established (first part of the table), we have included pulsars, like PSR B0628−28, for which there is only some evidence for it (second part of the table).
The values of temperature and radius for each blackbody, with the corresponding errors, are taken from the most recent works present in literature (references in the last column of Table 7), and, when needed, we rescaled the radii using updated distance values. The bolometric luminosities of these thermal components are evaluated as Lbol = πR2σT4 and we included the distance uncertainties in their errors.
All the temperatures are in the narrow range 0.1–0.3 keV and do not depend significantly on the characteristic age. On the contrary, the emissionradii span nearly two orders of magnitudes. We expected the emitting region to be related to the polar cap size, so we compared RBB with the radius of the polar cap defined by the last closed lines in a dipolar field geometry, 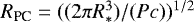 . As shown in Fig. 10, in most pulsars with 0.1 < τ < 10 Myr the two radii are consistent, considering the errors, and there is no clear correlation between RBB/RPC and characteristic age. Some pulsars have RBB that is significantly smaller than RPC, but this can be explained by geometrical effects. In fact, the radii inferred from the spectral fits correspond to the projected area of the emitting region averaged over the star rotational phase. Only for nearly aligned rotators (small angles between rotation and magnetic axis) seen pole-on does
  correspond to the real emitting area. This should occur, for example for PSR B0943+10 (Deshpande & Rankin 2001; Bilous et al. 2014); however, it has RBB < RPC, which might indicate that the magnetic field is not purely dipolar. The presence of multipolar components of the field can cause a reduction of the polar cap area by a factor Bs∕Bd, where Bs and Bd are the actual magnetic field at the star surface and that of the dipole, respectively (Gil & Sendyk 2000). PSR B0656+14, on the other hand, has a blackbody radius that is nearly ten times larger than RPC, as already noticed by De Luca et al. (2005), suggesting the need for a different explanation of the hot thermal component in this pulsar. One possibility is that anisotropic thermal conduction in the crust plays a role in causing temperature gradients on the surface, andthe oversimplified modelling with just two blackbodies at different temperatures gives unrealistic parameters.
It is also interesting to compare the thermal polar cap emission of old (non-recycled) pulsars with that observed in millisecond pulsars. Thermal X-rays have been detected in several millisecond pulsars (Bogdanov et al. 2006; Zavlin 2006; Spiewak et al. 2016; Bhattacharya et al. 2017). For two of them (PSR J0030+0451 Bogdanov & Grindlay 2009; PSR J0437−4715 Bogdanov 2013) at least two thermal components are needed, which are interpreted as emission from the polar cap having a non-uniform temperature distribution with a hot core and a cooler rim. We have included millisecond pulsars in Fig. 10 where we used the emission radii derived from blackbody fits in order to make a consistent comparison with the values of non-recycled pulsars. We note that fits with a non-magnetized hydrogen atmosphere model, which are appropriate for millisecond pulsars, would result in emitting radii larger by a factor ~4, thus making most of them consistent with the polar cap radii in the centred dipole approximation.
Thermal emission from small hot spots has been explored in detail by Harding & Muslimov (1998, 2001, 2002) in the context of polar cap models. In their Space Charge Limited Flow model, primary particles accelerated above the polar cap produce a photon-pairs cascade in an avalanche process. Backward particles screen the acceleration voltage drop and heat the polar cap. The pair cascade can be initiated either by curvature radiation (CR) or by inverse-Compton scattering (ICS) of thermal X-rays by primary electrons. The production of CR photons requires a much higher energy of the primary particles, and therefore the pair production occurs at higher altitude and the pair heating luminosity is expected to be much higher in the CR rather than in the ICS scenario. These processes can occur only above the corresponding “death lines” in the Ṗ −P diagram. Pulsars in the region below the CR pairs death line, but above that of ICS, can produce pairs only from ICS photons.
Harding & Muslimov (2002) give analytic expressions for the expected surface X-ray luminosity, depending on the pair fronts creation mechanism. In the case of non-recycled pulsars, Lbol ≈ 1031 erg s−1 P−1∕2 for CR and Lbol ≈ 2.0 × 1027 erg s−1 P−3∕2 for ICS. These relations, which should be considered as upper limits in the case of incomplete screening, are compared with the observed thermal luminosities of the pulsars in Fig. 11. Although there is a general agreement between the data and the model predictions, we note that among the three pulsars for which only the ICS mechanism should operate (indicated in Fig. 11 by a square), two have luminosities above the maximum predicted in this scenario. One of them is PSR B0628−28, for which the possible thermal origin of the pulsed flux is admittedly not very compelling. On the other hand, the presence of a thermal component in PSR B0943+10 is well established (Mereghetti et al. 2016) and possibly requires a different explanation.
Thermal emission properties.
 |
Fig. 10 Ratio of the radius of emitting area inferred from the blackbody fit to the polar cap radius as a function of the pulsar characteristic age. Millisecond pulsars are indicated with crosses. In the case of multiple thermal components (PSR J0030+0451 two components, PSR J0437−4715 three components), all the radii are plotted. |
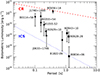 |
Fig. 11 Bolometric luminosity of hot polar cap emission versus rotation period. The lines represent the predicted thermal luminosities in case of curvature radiation (red dashed line) and inverse-Compton scattering (blue dotted line) pair fronts. The theoretical lines are from Harding & Muslimov (2002) in the case of non-recycled pulsars. Pulsars marked with a square are expected to produce pairs only from ICS photons. The error bars on the bolometric luminosity are computed taking into account both the uncertainties of the blackbody fit and those on the distances. See Table 7 for details. |
5 Conclusions
We applied the powerful ML technique to the spectral X-ray analysis of four dim rotation-powered old pulsars and found evidence for absorption lines at 0.22 and 0.44 keV in the spectrum of PSR B1133+16. If these lines are interpreted as cyclotron features due to protons they imply a magnetic field of a few 1013 G, higher thanthe dipole field inferred from the timing parameters of the pulsar (Bd= 2 × 10¹² G).
The presence of thermal emission from a hot polar cap could be established only for PSR B0114+58. Data of better statistical quality are required to ascertain if thermal components are really needed, also in the three other pulsars considered here: PSR B0628−28, PSR B0919+06, and PSR B1133+16. Several old pulsars show the presence of thermal components in their X-ray spectra. By using the most updated spectral results and distance estimates, we found that the sizes of the emitting hot spots in these pulsars are generally consistent with the expected dimensions of the polar caps once projection effects are taken into account.
Acknowledgements
This work has been partially supported through PRIN INAF 2014.
References
- Becker, W. 2009, Astrophys. Space Sci. Lib., 357, 91 [NASA ADS] [CrossRef] [Google Scholar]
- Becker, W., Jessner, A., Kramer, M., Testa, V., & Howaldt, C. 2005, ApJ, 633, 367 [NASA ADS] [CrossRef] [Google Scholar]
- Bhattacharya, S., Heinke, C. O., Chugunov, A. I., et al. 2017, MNRAS, 472, 3706 [NASA ADS] [CrossRef] [Google Scholar]
- Bilous, A. V., Hessels, J. W. T., Kondratiev, V. I., et al. 2014, A&A, 572, A52 [NASA ADS] [CrossRef] [EDP Sciences] [Google Scholar]
- Bogdanov, S. 2013, ApJ, 762, 96 [NASA ADS] [CrossRef] [Google Scholar]
- Bogdanov, S., & Grindlay, J. E. 2009, ApJ, 703, 1557 [NASA ADS] [CrossRef] [Google Scholar]
- Bogdanov, S., Grindlay, J. E., Heinke, C. O., et al. 2006, ApJ, 646, 1104 [NASA ADS] [CrossRef] [Google Scholar]
- De Luca, A., Caraveo, P. A., Mereghetti, S., Negroni, M., & Bignami, G. F. 2005, ApJ, 623, 1051 [NASA ADS] [CrossRef] [Google Scholar]
- Deshpande, A. A., & Rankin, J. M. 2001, MNRAS, 322, 438 [NASA ADS] [CrossRef] [Google Scholar]
- Gil, J. A., & Sendyk, M. 2000, ApJ, 541, 351 [NASA ADS] [CrossRef] [Google Scholar]
- Gil, J., Melikidze, G., & Geppert, U. 2003, A&A, 407, 315 [NASA ADS] [CrossRef] [EDP Sciences] [Google Scholar]
- Gil, J., Melikidze, G., & Zhang, B. 2007, MNRAS, 376, L67 [CrossRef] [Google Scholar]
- Gil, J., Haberl, F., Melikidze, G., et al. 2008, ApJ, 686, 497 [NASA ADS] [CrossRef] [Google Scholar]
- Harding, A. K. 2013, Frontiers of Physics, 8, 679 [Google Scholar]
- Harding, A. K., & Muslimov, A. G. 1998, ApJ, 508, 328 [NASA ADS] [CrossRef] [Google Scholar]
- Harding, A. K., & Muslimov, A. G. 2001, ApJ, 556, 987 [NASA ADS] [CrossRef] [Google Scholar]
- Harding, A. K., & Muslimov, A. G. 2002, ApJ, 568, 862 [NASA ADS] [CrossRef] [Google Scholar]
- He, C., Ng, C.-Y., & Kaspi, V. M. 2013, ApJ, 768, 64 [NASA ADS] [CrossRef] [Google Scholar]
- Hermsen, W., Hessels, J. W. T., Kuiper, L., et al. 2013, Science, 339, 436 [NASA ADS] [CrossRef] [Google Scholar]
- Hermsen, W., Kuiper, L., Hessels, J. W. T., et al. 2017, MNRAS, 466, 1688 [CrossRef] [Google Scholar]
- Kargaltsev, O., Pavlov, G. G., & Garmire, G. P. 2006, ApJ, 636, 406 [NASA ADS] [CrossRef] [Google Scholar]
- Kargaltsev, O., Durant, M., Misanovic, Z., & Pavlov, G. G. 2012, Science, 337, 946 [NASA ADS] [CrossRef] [Google Scholar]
- Klingler, N., Rangelov, B., Kargaltsev, O., et al. 2016, ApJ, 833, 253 [NASA ADS] [CrossRef] [Google Scholar]
- Manchester, R. N., Hobbs, G. B., Teoh, A., & Hobbs, M. 2005, VizieR Online Data Catalog:VII/245 [Google Scholar]
- Mereghetti, S., Kuiper, L., Tiengo, A., et al. 2016, ApJ, 831, 21 [CrossRef] [Google Scholar]
- Mignani, R. P., Pavlov, G. G., & Kargaltsev, O. 2010, ApJ, 720, 1635 [NASA ADS] [CrossRef] [Google Scholar]
- Misanovic, Z., Pavlov, G. G., & Garmire, G. P. 2008, ApJ, 685, 1129 [NASA ADS] [CrossRef] [Google Scholar]
- Prinz, T., & Becker, W. 2015, ApJ, submitted [arXiv:1511.07713] [Google Scholar]
- Spiewak, R., Kaplan, D. L., Archibald, A., et al. 2016, ApJ, 822, 37 [CrossRef] [Google Scholar]
- Strüder, L., Briel, U., Dennerl, K., et al. 2001, A&A, 365, L18 [NASA ADS] [CrossRef] [EDP Sciences] [Google Scholar]
- Szary, A., Gil,J., Zhang, B., et al. 2017, ApJ, 835, 178 [NASA ADS] [CrossRef] [Google Scholar]
- Tepedelenlioǧlu, E., & Ögelman, H. 2005, ApJ, 630, L57 [CrossRef] [Google Scholar]
- Turner, M. J. L., Abbey, A., Arnaud, M., et al. 2001, A&A, 365, L27 [NASA ADS] [CrossRef] [EDP Sciences] [Google Scholar]
- Verbiest, J. P. W., Weisberg, J. M., Chael, A. A., Lee, K. J., & Lorimer, D. R. 2012, ApJ, 755, 39 [NASA ADS] [CrossRef] [Google Scholar]
- Yao, J. M., Manchester, R. N., & Wang, N. 2017, ApJ, 835, 29 [NASA ADS] [CrossRef] [Google Scholar]
- Zavlin, V. E. 2006, ApJ, 638, 951 [NASA ADS] [CrossRef] [Google Scholar]
- Zharikov, S., & Mignani, R. P. 2013, MNRAS, 435, 2227 [NASA ADS] [CrossRef] [Google Scholar]
- Zharikov, S. V., Shibanov, Y. A., Mennickent, R. E., & Komarova, V. N. 2008, A&A, 479, 793 [NASA ADS] [CrossRef] [EDP Sciences] [Google Scholar]
All Tables
All Figures
|
Fig. 1 Confidence regions (1, 2, and 3σ) of the best fit parameters for the spectra of (a) PSR B0628−28, (b) PSR B0919+06, (c) PSR B0114+58, and (d) PSR B1133+16. The best fit values are indicated by a plus and the DM-based value of NH by a dashed line. |
| In the text | |
|
Fig. 2 EPIC-pn (blue diamonds) and -MOS (red squares) X-ray spectra of PSR B0628−28. The best fit power law is shown in the top panel, and the corresponding residuals in the middle panel. The bottom panel shows the residuals obtained by fitting the spectra with an absorbed blackbody. |
| In the text | |
|
Fig. 3 Upper limits (3σ confidence level) on the blackbody component in PSR B0628−28 as a function of blackbody temperature. The top panel gives the limits on the emitting radius, while the lower panel gives the corresponding limits on the bolometric luminosity computed as Lbol =πR2σT4. |
| In the text | |
|
Fig. 4 Left: pulsed fraction of PSR B0628−28 as a function of energy obtained with the 3D-ML analysis. Right: EPIC-pn total (black circles), unpulsed (blue diamonds), and pulsed (red squares) spectra of PSR B0628−28. |
| In the text | |
|
Fig. 5 EPIC-pn (blue diamonds) and -MOS (red squares) X-ray spectra of PSR B0919+06. The best fit power law is shown in the top panel, and the corresponding residuals in the middle panel. The bottom panel shows the residuals obtained by fitting the spectra with an absorbed blackbody. |
| In the text | |
|
Fig. 6 Upper limits (3σ confidence level) on the blackbody component in PSR B0919+06, as a function of blackbody temperature. The top panel gives the limits on the emitting radius, while the lower panel gives the corresponding limits on the bolometric luminosity computed as Lbol =πR2σT4. |
| In the text | |
|
Fig. 7 Confidence regions (1, 2, and 3σ) of the best fit line strength vs. width of the two absorption lines in the spectrum of PSR B1133+16 (dashed lines: E1 ~ 0.22 keV, solid lines: E2 ~ 0.44 keV). The best fit values are indicated by a black plus. |
| In the text | |
|
Fig. 8 EPIC-pn spectrum of PSR B1133+16. The top panel shows the best fit with an absorbed power law plus two absorption lines at E1 ~ 0.22 and E2 ~ 0.44 keV. The corresponding residuals are shown in the middle panel. The bottom panel shows the residuals obtained by the best fit with a single power law in the range 0.5–10 keV. |
| In the text | |
|
Fig. 9 Left: pulsed fraction of PSR B1133+16 as a function of energy obtained with the 3D-ML analysis. Right: EPIC-pn total (black circles), unpulsed (blue diamonds), and pulsed (red squares) spectra of PSR B1133+16. |
| In the text | |
|
Fig. 10 Ratio of the radius of emitting area inferred from the blackbody fit to the polar cap radius as a function of the pulsar characteristic age. Millisecond pulsars are indicated with crosses. In the case of multiple thermal components (PSR J0030+0451 two components, PSR J0437−4715 three components), all the radii are plotted. |
| In the text | |
|
Fig. 11 Bolometric luminosity of hot polar cap emission versus rotation period. The lines represent the predicted thermal luminosities in case of curvature radiation (red dashed line) and inverse-Compton scattering (blue dotted line) pair fronts. The theoretical lines are from Harding & Muslimov (2002) in the case of non-recycled pulsars. Pulsars marked with a square are expected to produce pairs only from ICS photons. The error bars on the bolometric luminosity are computed taking into account both the uncertainties of the blackbody fit and those on the distances. See Table 7 for details. |
| In the text | |
Current usage metrics show cumulative count of Article Views (full-text article views including HTML views, PDF and ePub downloads, according to the available data) and Abstracts Views on Vision4Press platform.
Data correspond to usage on the plateform after 2015. The current usage metrics is available 48-96 hours after online publication and is updated daily on week days.
Initial download of the metrics may take a while.