Free Access
Fig. 7
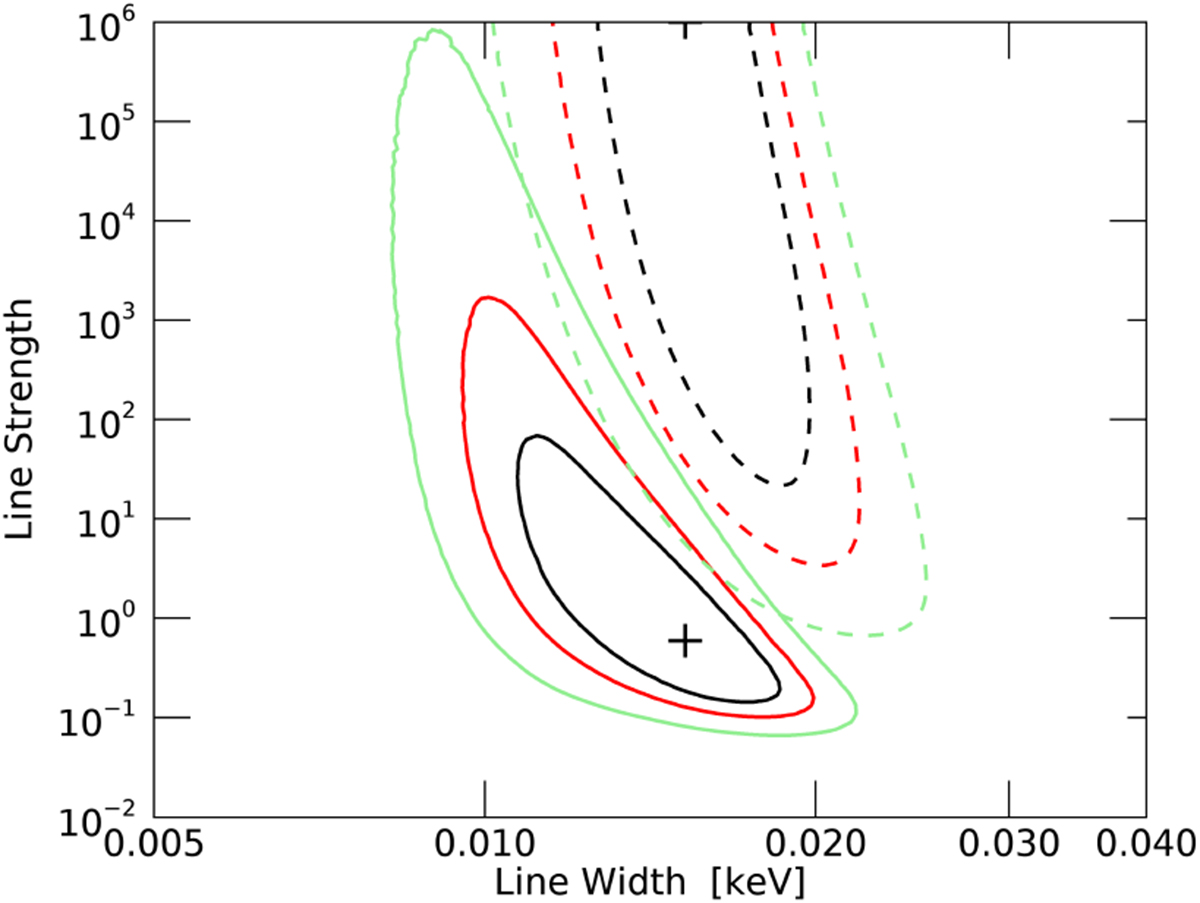
Confidence regions (1, 2, and 3σ) of the best fit line strength vs. width of the two absorption lines in the spectrum of PSR B1133+16 (dashed lines: E1 ~ 0.22 keV, solid lines: E2 ~ 0.44 keV). The best fit values are indicated by a black plus.
Current usage metrics show cumulative count of Article Views (full-text article views including HTML views, PDF and ePub downloads, according to the available data) and Abstracts Views on Vision4Press platform.
Data correspond to usage on the plateform after 2015. The current usage metrics is available 48-96 hours after online publication and is updated daily on week days.
Initial download of the metrics may take a while.