Free Access
Fig. 2
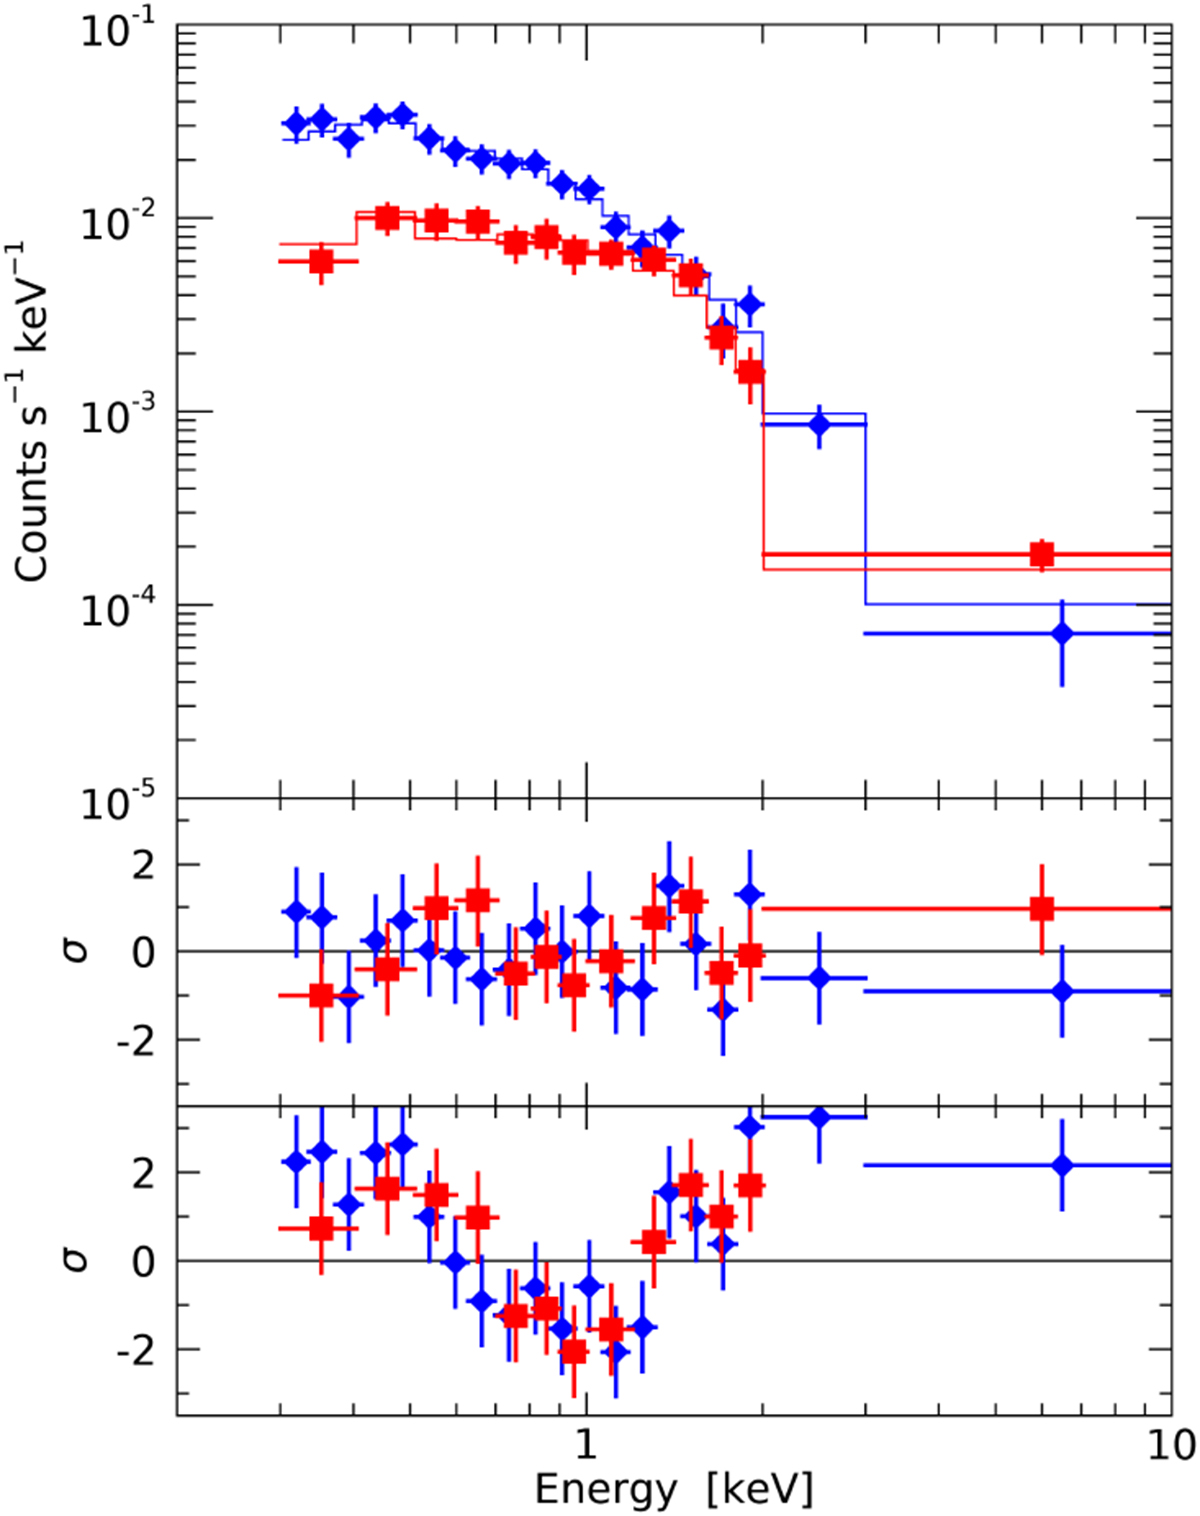
EPIC-pn (blue diamonds) and -MOS (red squares) X-ray spectra of PSR B0628−28. The best fit power law is shown in the top panel, and the corresponding residuals in the middle panel. The bottom panel shows the residuals obtained by fitting the spectra with an absorbed blackbody.
Current usage metrics show cumulative count of Article Views (full-text article views including HTML views, PDF and ePub downloads, according to the available data) and Abstracts Views on Vision4Press platform.
Data correspond to usage on the plateform after 2015. The current usage metrics is available 48-96 hours after online publication and is updated daily on week days.
Initial download of the metrics may take a while.