Fig. 8
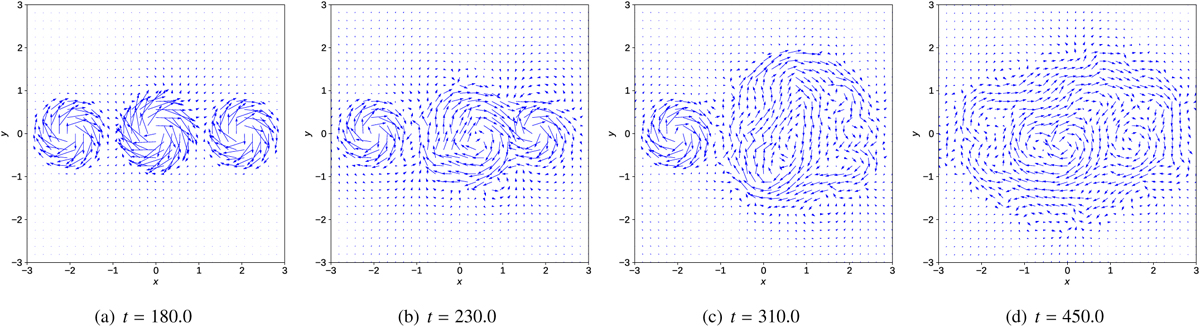
Arrows indicating the strength and direction of the magnetic field in the mid-plane in z. The times shown are for t = 180 (panel a), t = 230 (panel b), t = 310 (panel c), and t = 450 (panel d), corresponding with the times in Fig. 5. The longest arrows correspond to a field strength in the x, y-plane of 0.787 (panel a), 0.486 (panel b), 0.655 (panel c), and 0.369 (panel d).
Current usage metrics show cumulative count of Article Views (full-text article views including HTML views, PDF and ePub downloads, according to the available data) and Abstracts Views on Vision4Press platform.
Data correspond to usage on the plateform after 2015. The current usage metrics is available 48-96 hours after online publication and is updated daily on week days.
Initial download of the metrics may take a while.