Fig. 7
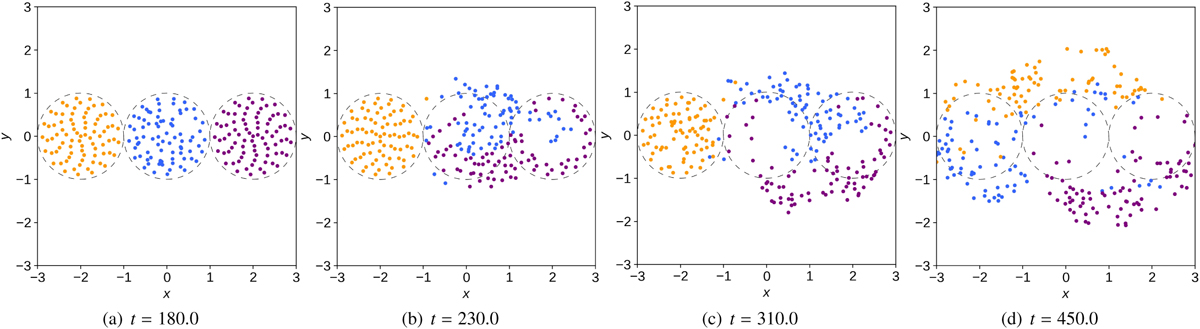
Locations on z = L to which field lines traced from z = −L connect. These are shown for t = 180 (panel a), t = 230 (panel b), t = 310 (panel c), and t = 450 (panel d), corresponding with the times in Fig. 5. Field lines in blue begin in the central thread, those in orange in the left, and those in purple in the right. These are produced from a lower resolution, 2562 × 1024, as for Fig. 6.
Current usage metrics show cumulative count of Article Views (full-text article views including HTML views, PDF and ePub downloads, according to the available data) and Abstracts Views on Vision4Press platform.
Data correspond to usage on the plateform after 2015. The current usage metrics is available 48-96 hours after online publication and is updated daily on week days.
Initial download of the metrics may take a while.