Fig. 6
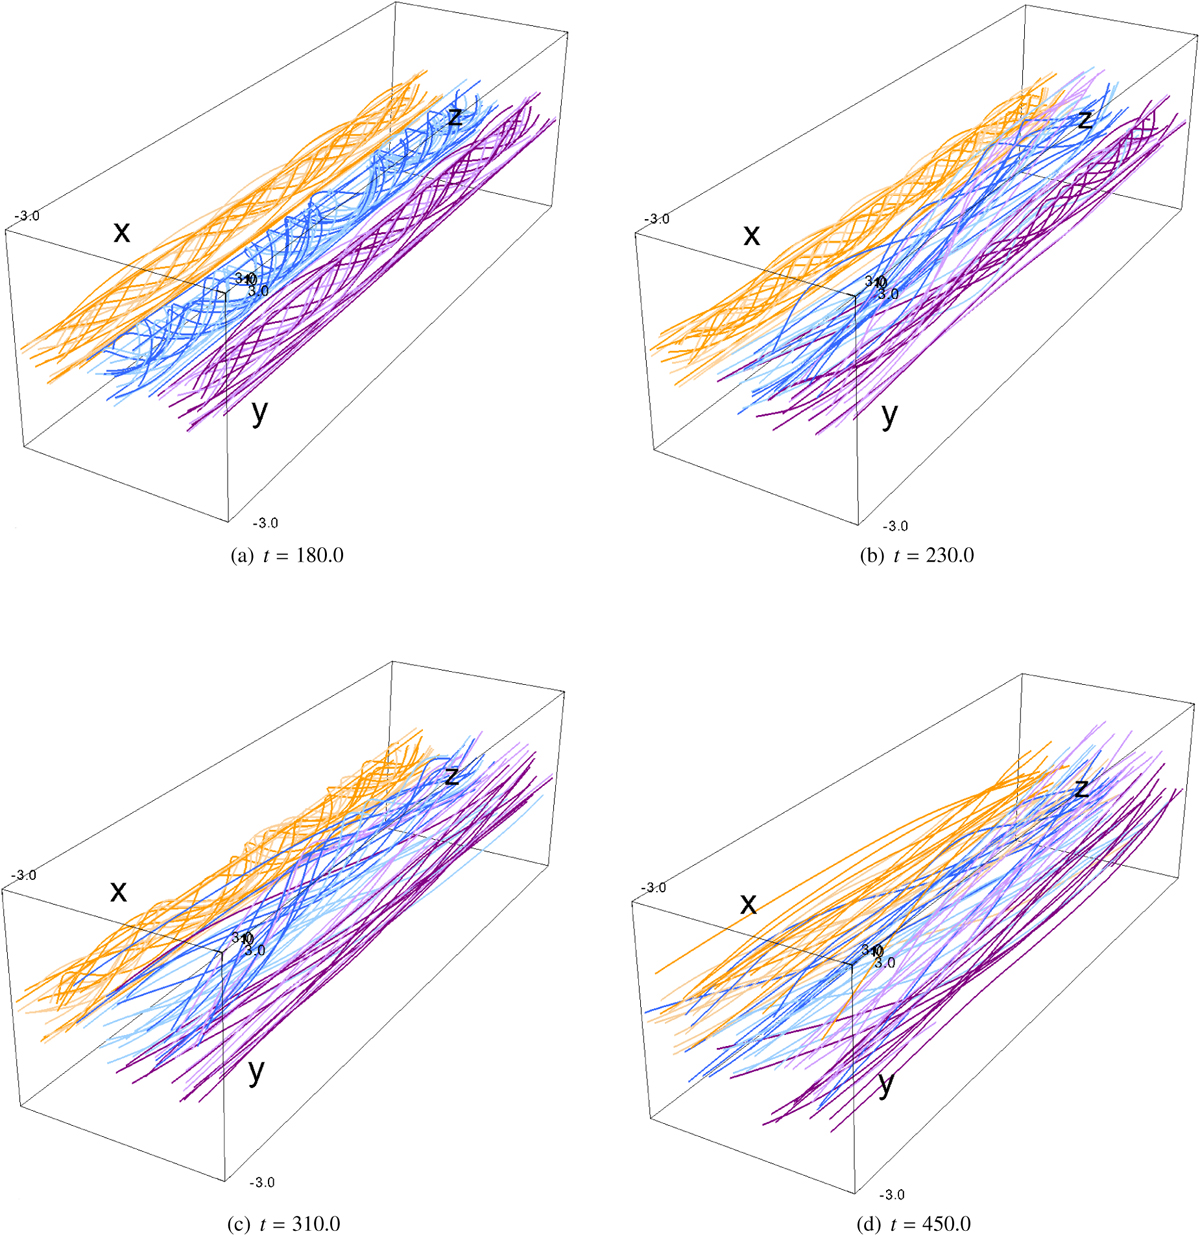
Field lines traced from each driven boundary, z = ±L. Here, the field lines drawn at t = 180 (panel a), t = 230 (panel b), t = 310 (panel c), and t = 450 (panel d), corresponding with the times in Fig. 5, are visible. The darker field lines are traced from the bottom boundary, and the lighter from the top. These are produced from a lower resolution, 2562 × 1024, because of limits on computational resources.
Current usage metrics show cumulative count of Article Views (full-text article views including HTML views, PDF and ePub downloads, according to the available data) and Abstracts Views on Vision4Press platform.
Data correspond to usage on the plateform after 2015. The current usage metrics is available 48-96 hours after online publication and is updated daily on week days.
Initial download of the metrics may take a while.