Fig. 4
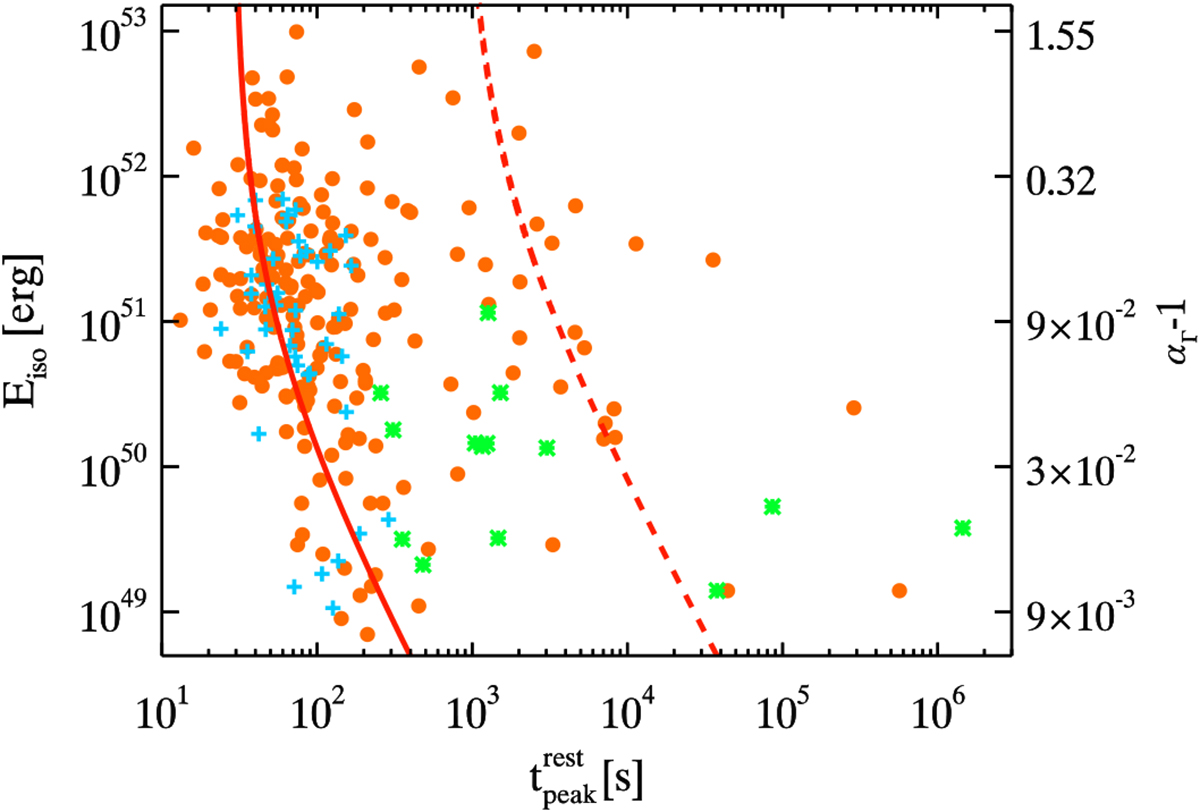
Isotropic energy (computed in the XRT energy range) of XRF versus their rest frame peak time. The right-hand vertical axis shows the values of αΓ (rescaled by 1) corresponding to the values of Eiso through Eq. (2). Different symbols and colours refer to different samples collected from the literature. Orange points, green asterisks, and cyan crosses are associated with XRF (only those with a measured redshift) from Yi et al. (2016), Bernardini et al. (2011), and Chincarini et al. (2010), respectively. The solid (dashed) red line shows the behaviour of the isotropic energy vs. flare peak time predicted considering two shells emitted with a delay Δ T = 30 (1000) s with respect to the start of the prompt emission and with a separation Δ R = 7 × 10¹⁰ (7 × 10¹²) cm.
Current usage metrics show cumulative count of Article Views (full-text article views including HTML views, PDF and ePub downloads, according to the available data) and Abstracts Views on Vision4Press platform.
Data correspond to usage on the plateform after 2015. The current usage metrics is available 48-96 hours after online publication and is updated daily on week days.
Initial download of the metrics may take a while.