Fig. 1
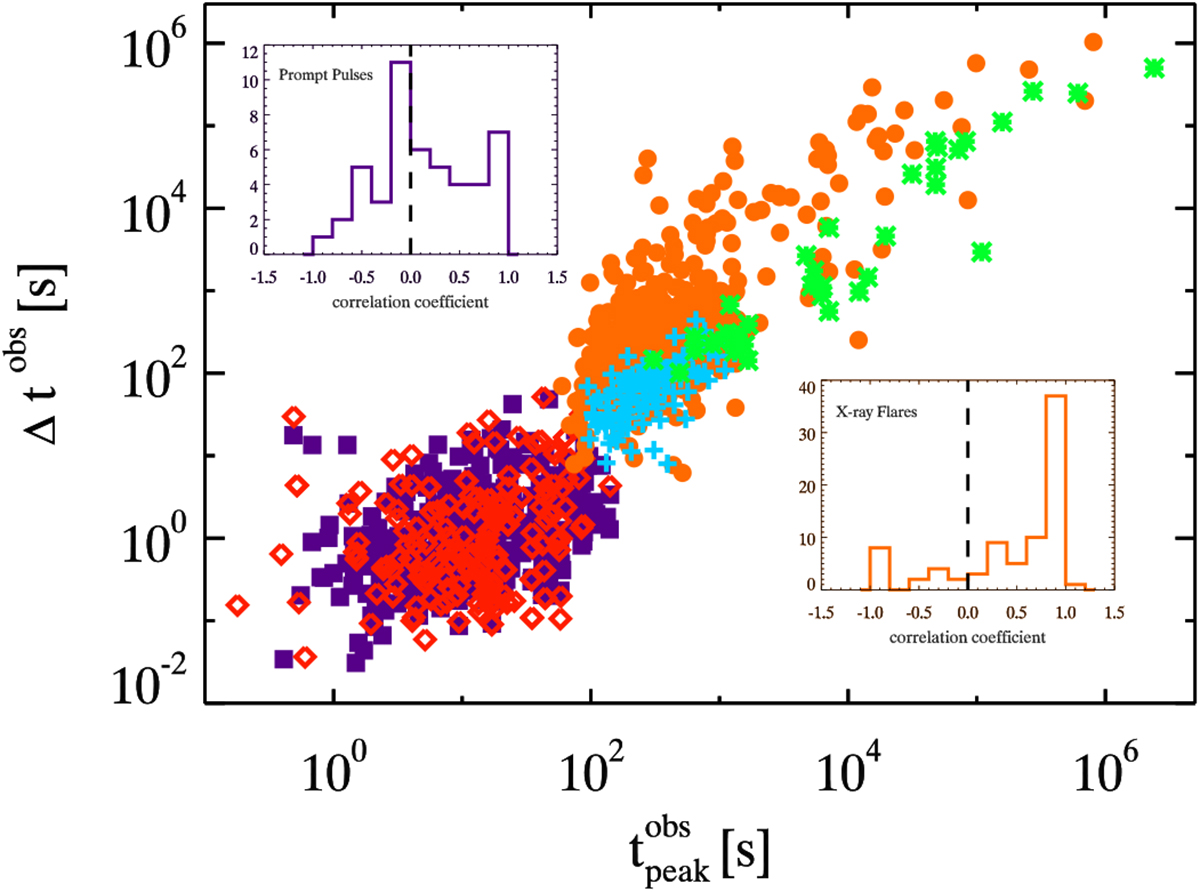
Observer frame pulse duration Δtobs vs. the pulse occurrence time (peak time – ![]() ). Times are given with respect to the trigger time. Prompt emission pulses of Fermi/GBM bursts (from Bhat et al. 2012) are shown with different symbols: purple squares show pulses obtained from the analysis of the GBM/NaI [8 keV–1 MeV] light curves, and red diamonds are pulses from GBM/BGO [200 keV–10 MeV] light curves. Orange points, green asterisks, and cyan crosses show XRF (from Yi et al. 2016, Bernardini et al. 2011 and Chincarini et al. 2010). The bottom right inset shows the chance probability vs. the correlation coefficient for the 16 GRBs out of 32 in the B12 sample with ≥10 pulses.
). Times are given with respect to the trigger time. Prompt emission pulses of Fermi/GBM bursts (from Bhat et al. 2012) are shown with different symbols: purple squares show pulses obtained from the analysis of the GBM/NaI [8 keV–1 MeV] light curves, and red diamonds are pulses from GBM/BGO [200 keV–10 MeV] light curves. Orange points, green asterisks, and cyan crosses show XRF (from Yi et al. 2016, Bernardini et al. 2011 and Chincarini et al. 2010). The bottom right inset shows the chance probability vs. the correlation coefficient for the 16 GRBs out of 32 in the B12 sample with ≥10 pulses.
Current usage metrics show cumulative count of Article Views (full-text article views including HTML views, PDF and ePub downloads, according to the available data) and Abstracts Views on Vision4Press platform.
Data correspond to usage on the plateform after 2015. The current usage metrics is available 48-96 hours after online publication and is updated daily on week days.
Initial download of the metrics may take a while.