Fig. A.3
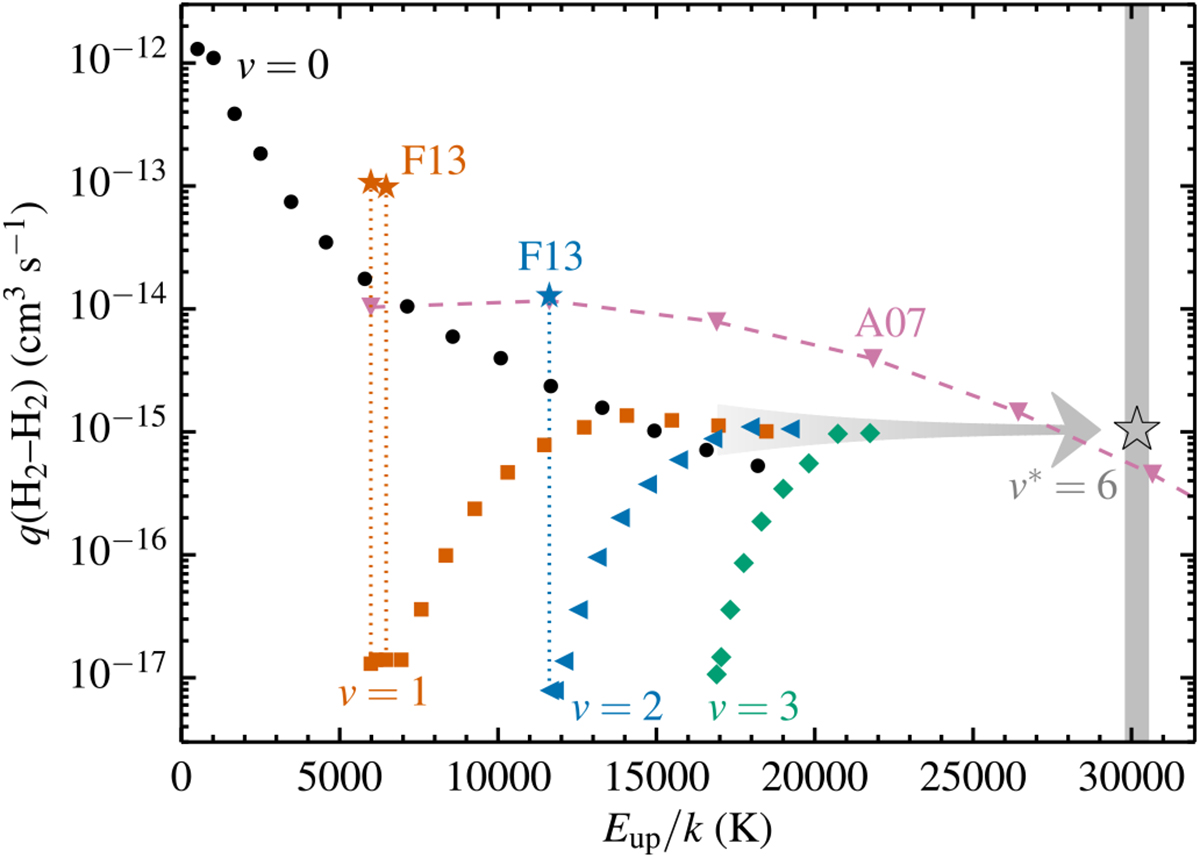
Same as Fig. A.1, but for H2 colliding with H2. The circles, squares, triangles and diamonds denote the overall cooling rate coefficients from a given v,J level to the ground state based on the state-to-state rates from Flower & Roueff (1998). The orange and blue stars show the v,J = 1,0, 1,2 and 2,0 vibration-vibration rates of Fonseca dos Santos et al. (2013). The lilac triangles and dashed curve show the VV rates of Ahn et al. (2007). The gray star marks the adopted rate for our v* = 6 pseudo-level; as indicated by the arrow, this is the rate that the v = 1, 2 and 3 series from Flower & Roueff converge to in the high-J limit.
Current usage metrics show cumulative count of Article Views (full-text article views including HTML views, PDF and ePub downloads, according to the available data) and Abstracts Views on Vision4Press platform.
Data correspond to usage on the plateform after 2015. The current usage metrics is available 48-96 hours after online publication and is updated daily on week days.
Initial download of the metrics may take a while.