Fig. 13
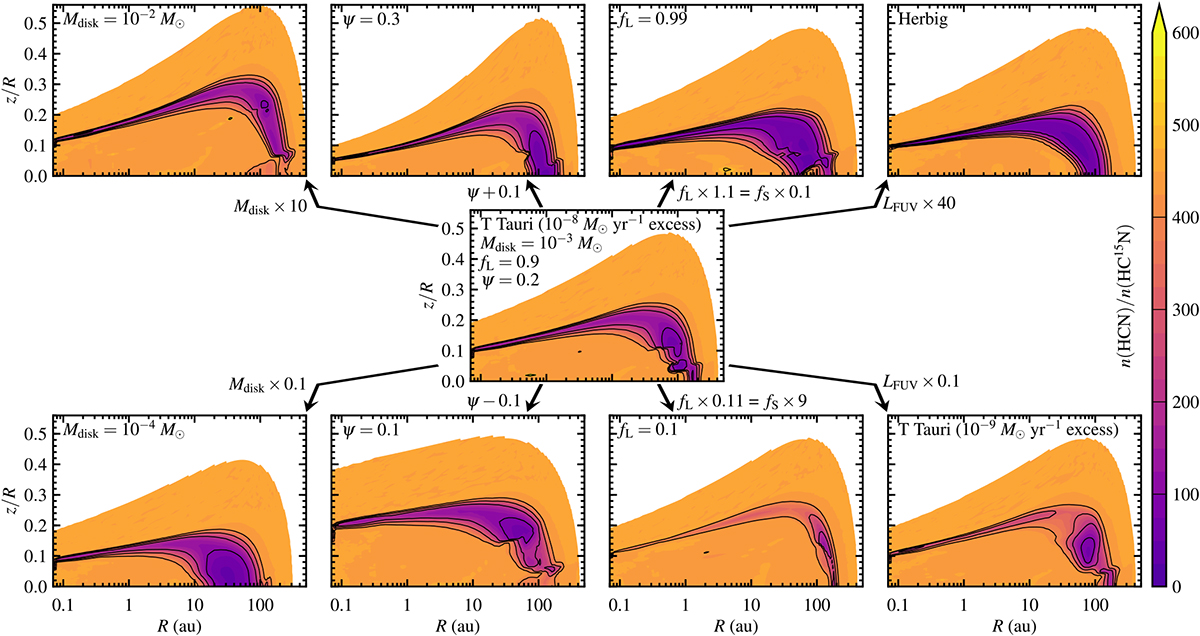
Abundance ratios of HCN over HC15N at 1 Myr for several sets of model parameters. The central panel is for the fiducial model from Sect. 3 and is the same as the top center panel in Fig. 6. The other panels show the result of changing one parameter at a time, as indicated with the labels on the arrows and within the panels. Contours are drawn at ratios of 100, 200, 300, 400 and 500.
Current usage metrics show cumulative count of Article Views (full-text article views including HTML views, PDF and ePub downloads, according to the available data) and Abstracts Views on Vision4Press platform.
Data correspond to usage on the plateform after 2015. The current usage metrics is available 48-96 hours after online publication and is updated daily on week days.
Initial download of the metrics may take a while.