Free Access
Fig. 3
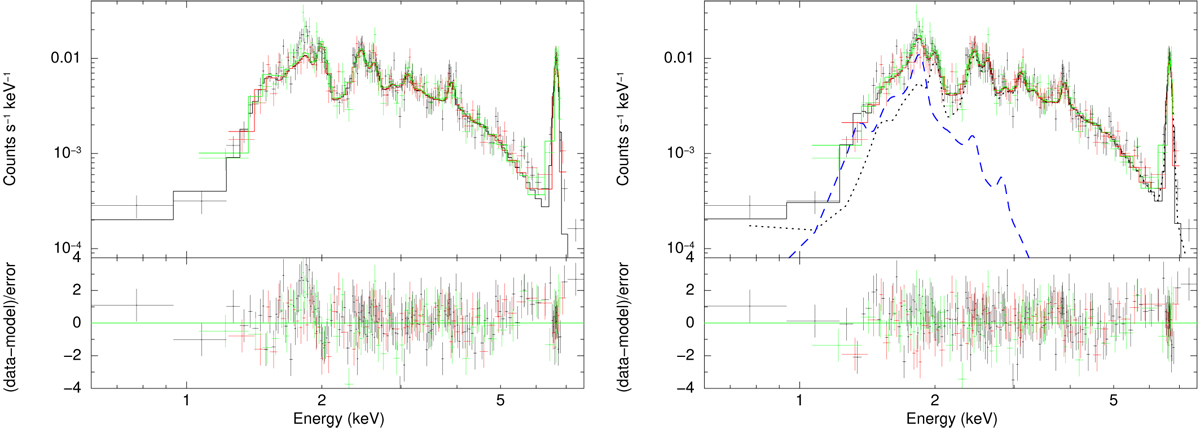
Exemplified ACIS-S spectra from one bin in W49B fitted with one component (vapec; left: ![]() ) and two components (apec in blue dashed line plus vapec in black dotted line; right:
) and two components (apec in blue dashed line plus vapec in black dotted line; right: ![]() ) models, respectively. The black, red, and green data correspond to the spectra from the observations 13 440, 13 441, and 117, respectively.
) models, respectively. The black, red, and green data correspond to the spectra from the observations 13 440, 13 441, and 117, respectively.
Current usage metrics show cumulative count of Article Views (full-text article views including HTML views, PDF and ePub downloads, according to the available data) and Abstracts Views on Vision4Press platform.
Data correspond to usage on the plateform after 2015. The current usage metrics is available 48-96 hours after online publication and is updated daily on week days.
Initial download of the metrics may take a while.