Fig. 2
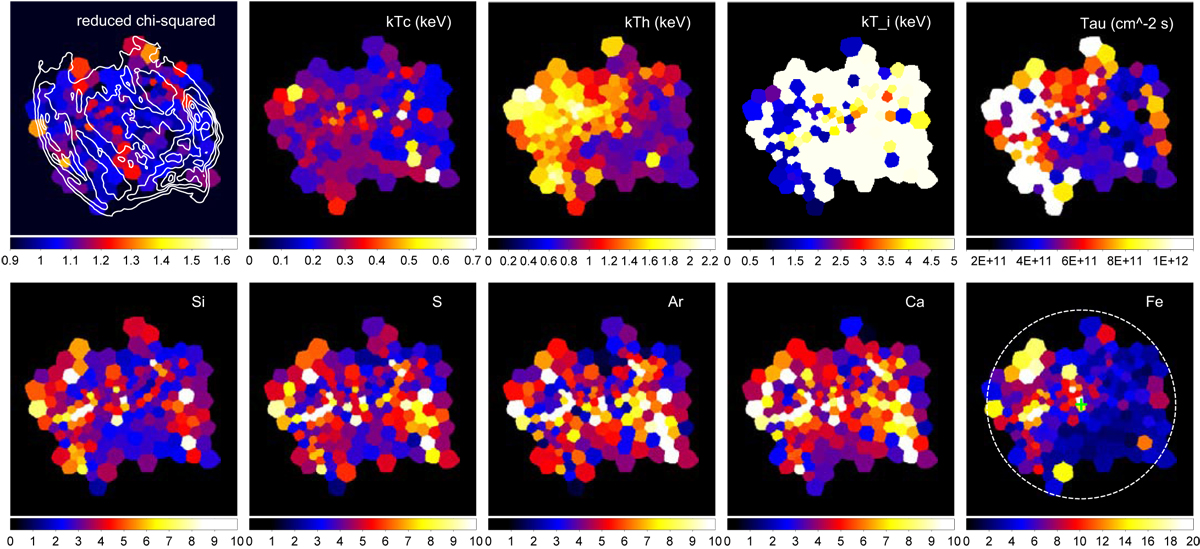
Distribution of the parameters fitted with the best-fit double component model, which was either an absorbed “hot vrnei + cool apec” model, or an absorbed “hot vapec + cool apec” model. First panel: ![]() overlaid with VLA 20 cm radio contours in white color. Last panel: dashed circle and the green cross sign denote the SNR sphere used for density calculation and the sphere center used for abundance – PA diagram in Fig. 10, respectively.
overlaid with VLA 20 cm radio contours in white color. Last panel: dashed circle and the green cross sign denote the SNR sphere used for density calculation and the sphere center used for abundance – PA diagram in Fig. 10, respectively.
Current usage metrics show cumulative count of Article Views (full-text article views including HTML views, PDF and ePub downloads, according to the available data) and Abstracts Views on Vision4Press platform.
Data correspond to usage on the plateform after 2015. The current usage metrics is available 48-96 hours after online publication and is updated daily on week days.
Initial download of the metrics may take a while.