Free Access
Fig. 1
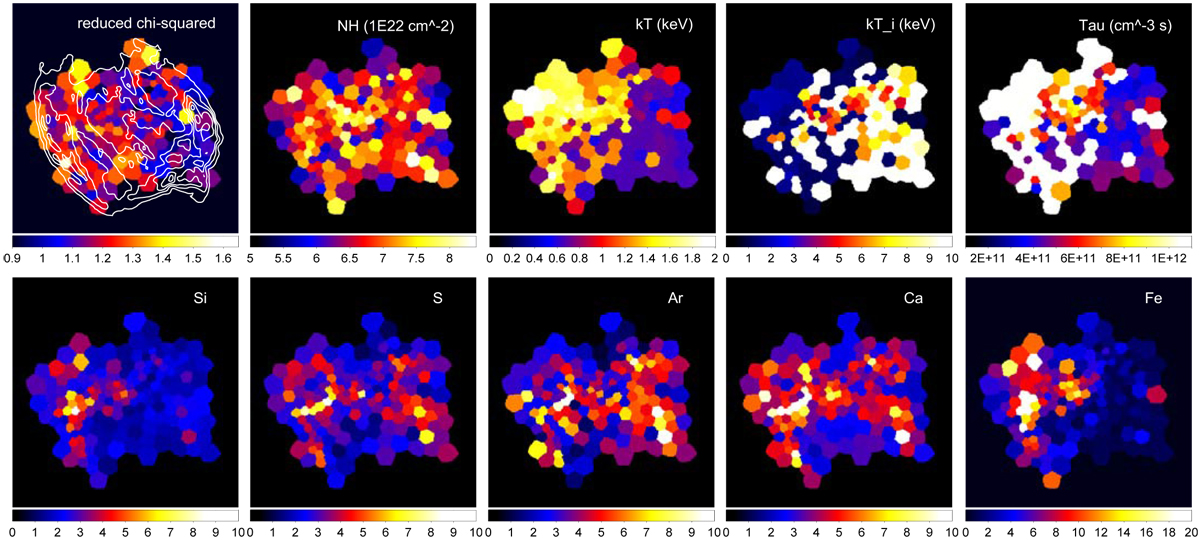
Distribution of the parameters fitted with the best-fit single component model, which, for every cell, was taken to be either the absorbed “vrnei” or the absorbed “apec” model, whichever produced the smallest![]() . First panel:
. First panel: ![]() overlaid with VLA 20 cm radio contours (Helfand et al. 2006) in white color.
overlaid with VLA 20 cm radio contours (Helfand et al. 2006) in white color.
Current usage metrics show cumulative count of Article Views (full-text article views including HTML views, PDF and ePub downloads, according to the available data) and Abstracts Views on Vision4Press platform.
Data correspond to usage on the plateform after 2015. The current usage metrics is available 48-96 hours after online publication and is updated daily on week days.
Initial download of the metrics may take a while.