Fig. 7
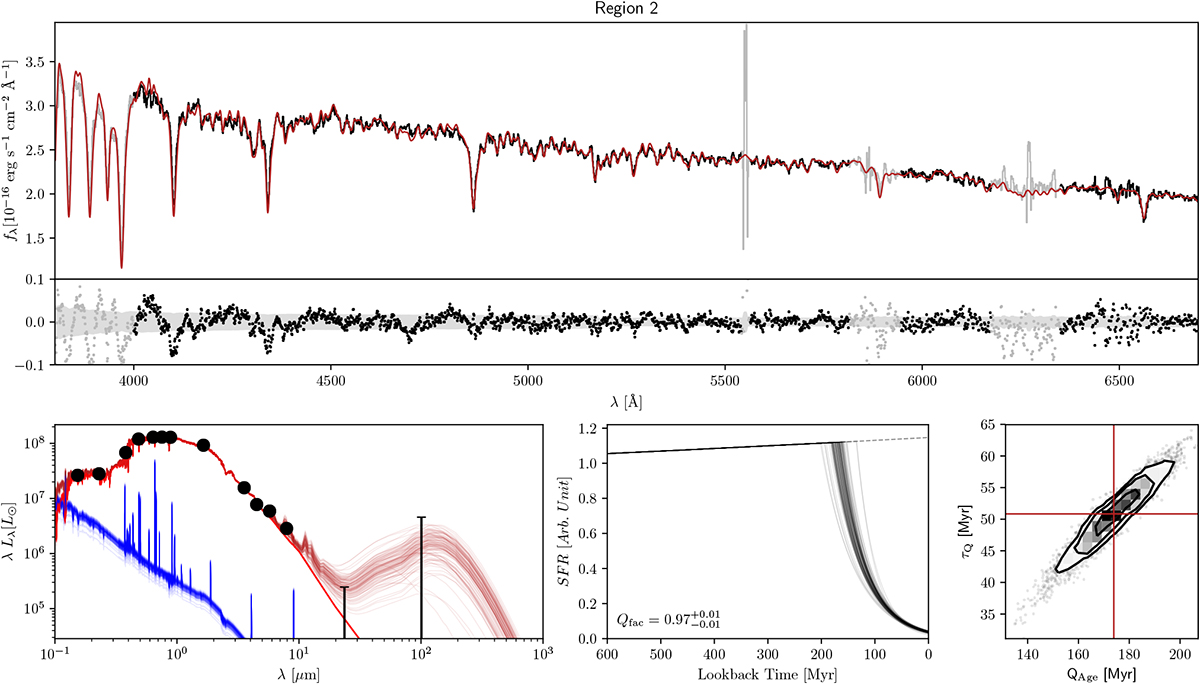
Results of the MC-SPF fitting for region 2. Upper panel: FORS2 spectrum (black) and best fit model (dark red). Regions where the spectrum is plotted in grey are not used in the fit. The fit residuals (Data – Model) are shown below the spectrum and the grey shaded area shows the 1σ uncertainties. Lower left panel: photometric data points in black (1σ upper limits from non-detections are shown as error bars). The blue lines are the stellar emission with nebular lines from the young component (Age < 10Myr), the red lines are from the old component (Age > 10Myr), and the dark red lines are the total model including the dust emission. Different lines are obtained by randomly sampling the posterior distribution. Lower middle panel: reconstructed SFH from the fitting procedure. Different lines are obtained from the posterior distribution. The grey dashed line showsthe evolution of the unperturbed SFH. Lower right panel: marginalised likelihood maps for the QAge and τQ fit parameters. The red lines show the median value for each parameter, while the black contours show the 1–3 σ confidence intervals.
Current usage metrics show cumulative count of Article Views (full-text article views including HTML views, PDF and ePub downloads, according to the available data) and Abstracts Views on Vision4Press platform.
Data correspond to usage on the plateform after 2015. The current usage metrics is available 48-96 hours after online publication and is updated daily on week days.
Initial download of the metrics may take a while.