Fig. 10
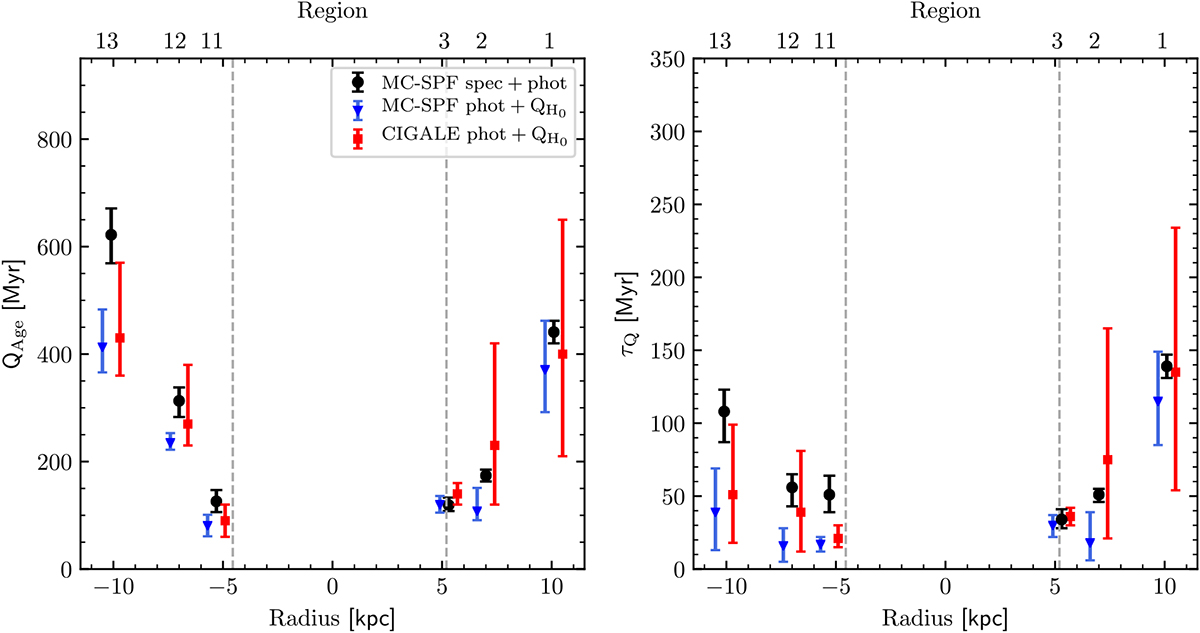
Left panel: comparison of the quenching ages (QAge) as a function of galactocentric radius derived by using different input data into the MC-SPF and CIGALE fitting codes. Black points are from MC-SPF joint fits to spectra and photometry using stellar libraries at solar metallicity (see also Fig. 8). Blue triangles are from MC-SPF fits to the photometric data plus a constraint on the number of ionising photons coming from the VESTIGE Hα imaging observations. Red squares are from CIGALE fits and use the same input data as the blue points. The points belonging to the same region are shifted along the x-axis for clarity. The vertical dashed lines show the truncation radius of the Hα emission along the major axis; inside these lines there is ongoing star formation activity. Right panel: same as the left panel, but for the exponential characteristic timescale of the quenching (τQ).
Current usage metrics show cumulative count of Article Views (full-text article views including HTML views, PDF and ePub downloads, according to the available data) and Abstracts Views on Vision4Press platform.
Data correspond to usage on the plateform after 2015. The current usage metrics is available 48-96 hours after online publication and is updated daily on week days.
Initial download of the metrics may take a while.