Fig. 5
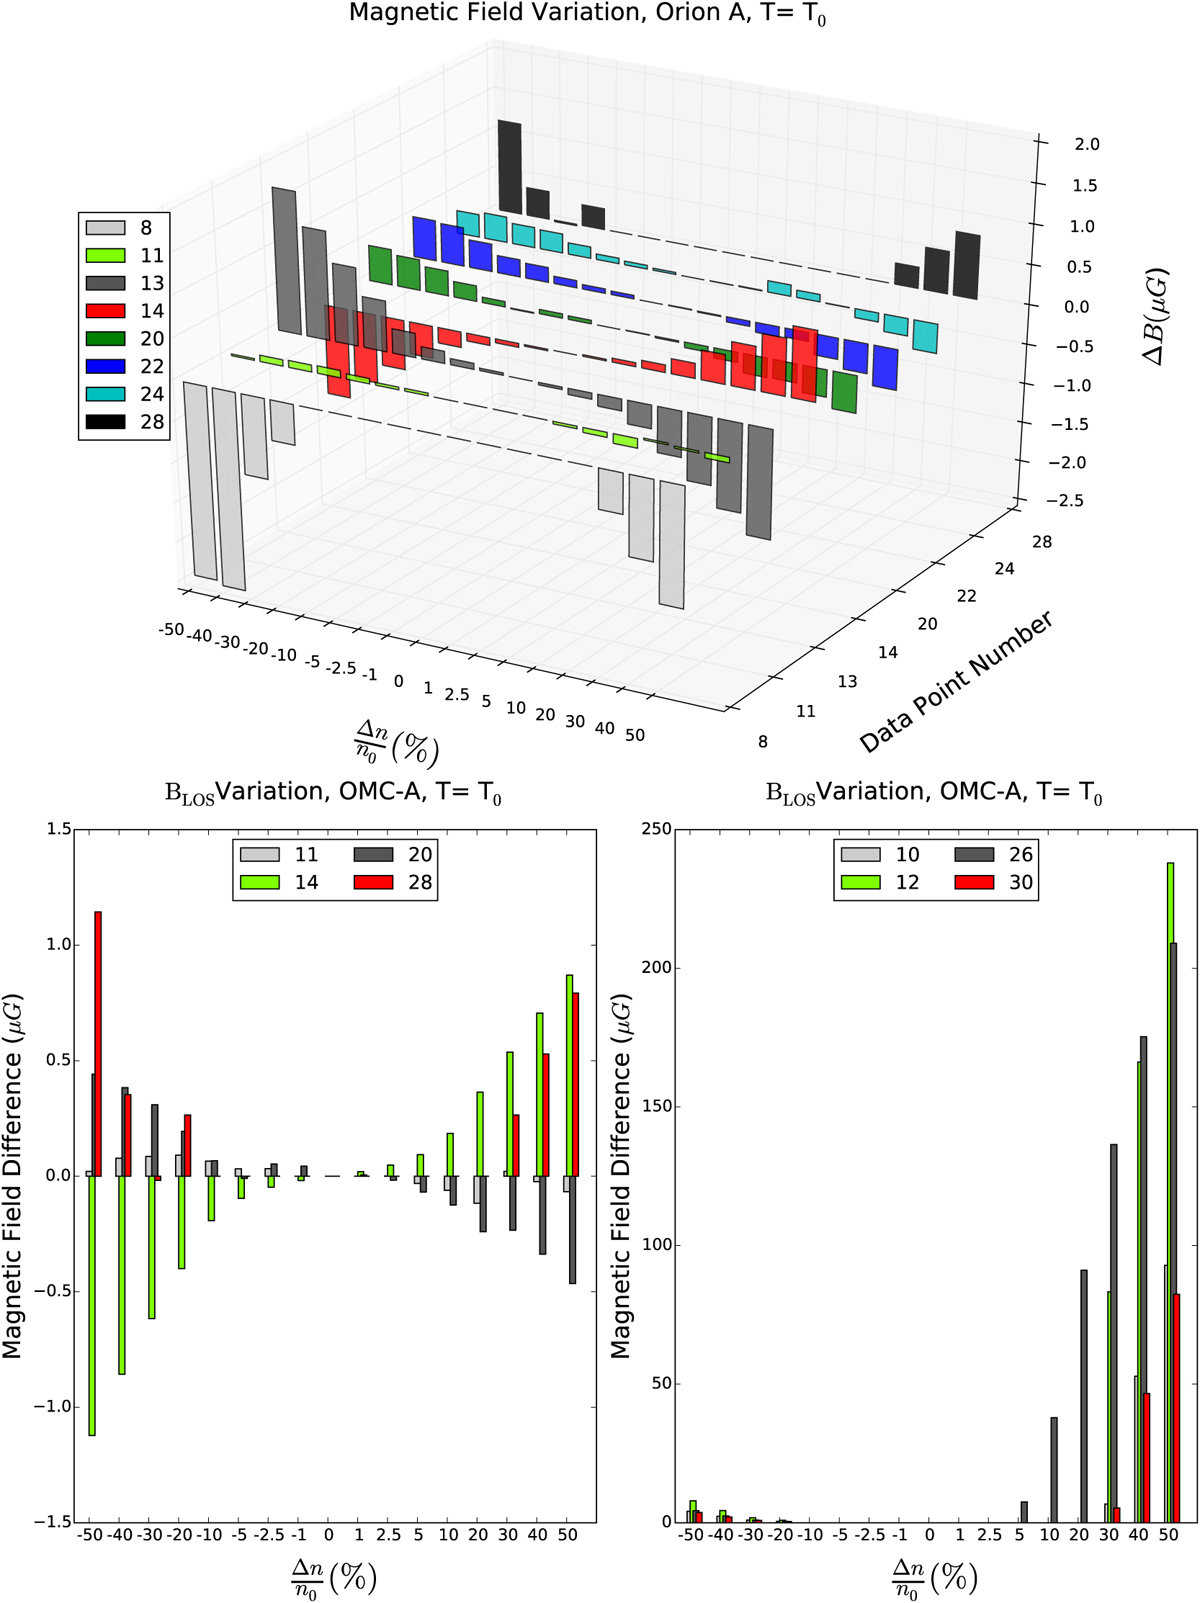
Uncertainties in BLOS due to uncertainties in the input volume density of the chemical evolution code. Top panel: BLOS variationfor a selection of positions in Orion A sampling regions with different AV. The x-axis (![]() ) indicates therelative (%) changes in input density to the chemical model. The y-axis labels the data points presented and corresponds to the positions labeled in Fig. 6. The z-axis plots the change in the magnetic field strength and direction from that calculated for the fiducial density n0 (104 cm−3). The bottom left panel shows BLOS uncertainties for points with AV < 1. The bottom right panel shows uncertainties in BLOS for a selection ofpoints with AV > 1.
) indicates therelative (%) changes in input density to the chemical model. The y-axis labels the data points presented and corresponds to the positions labeled in Fig. 6. The z-axis plots the change in the magnetic field strength and direction from that calculated for the fiducial density n0 (104 cm−3). The bottom left panel shows BLOS uncertainties for points with AV < 1. The bottom right panel shows uncertainties in BLOS for a selection ofpoints with AV > 1.
Current usage metrics show cumulative count of Article Views (full-text article views including HTML views, PDF and ePub downloads, according to the available data) and Abstracts Views on Vision4Press platform.
Data correspond to usage on the plateform after 2015. The current usage metrics is available 48-96 hours after online publication and is updated daily on week days.
Initial download of the metrics may take a while.