Fig. 2
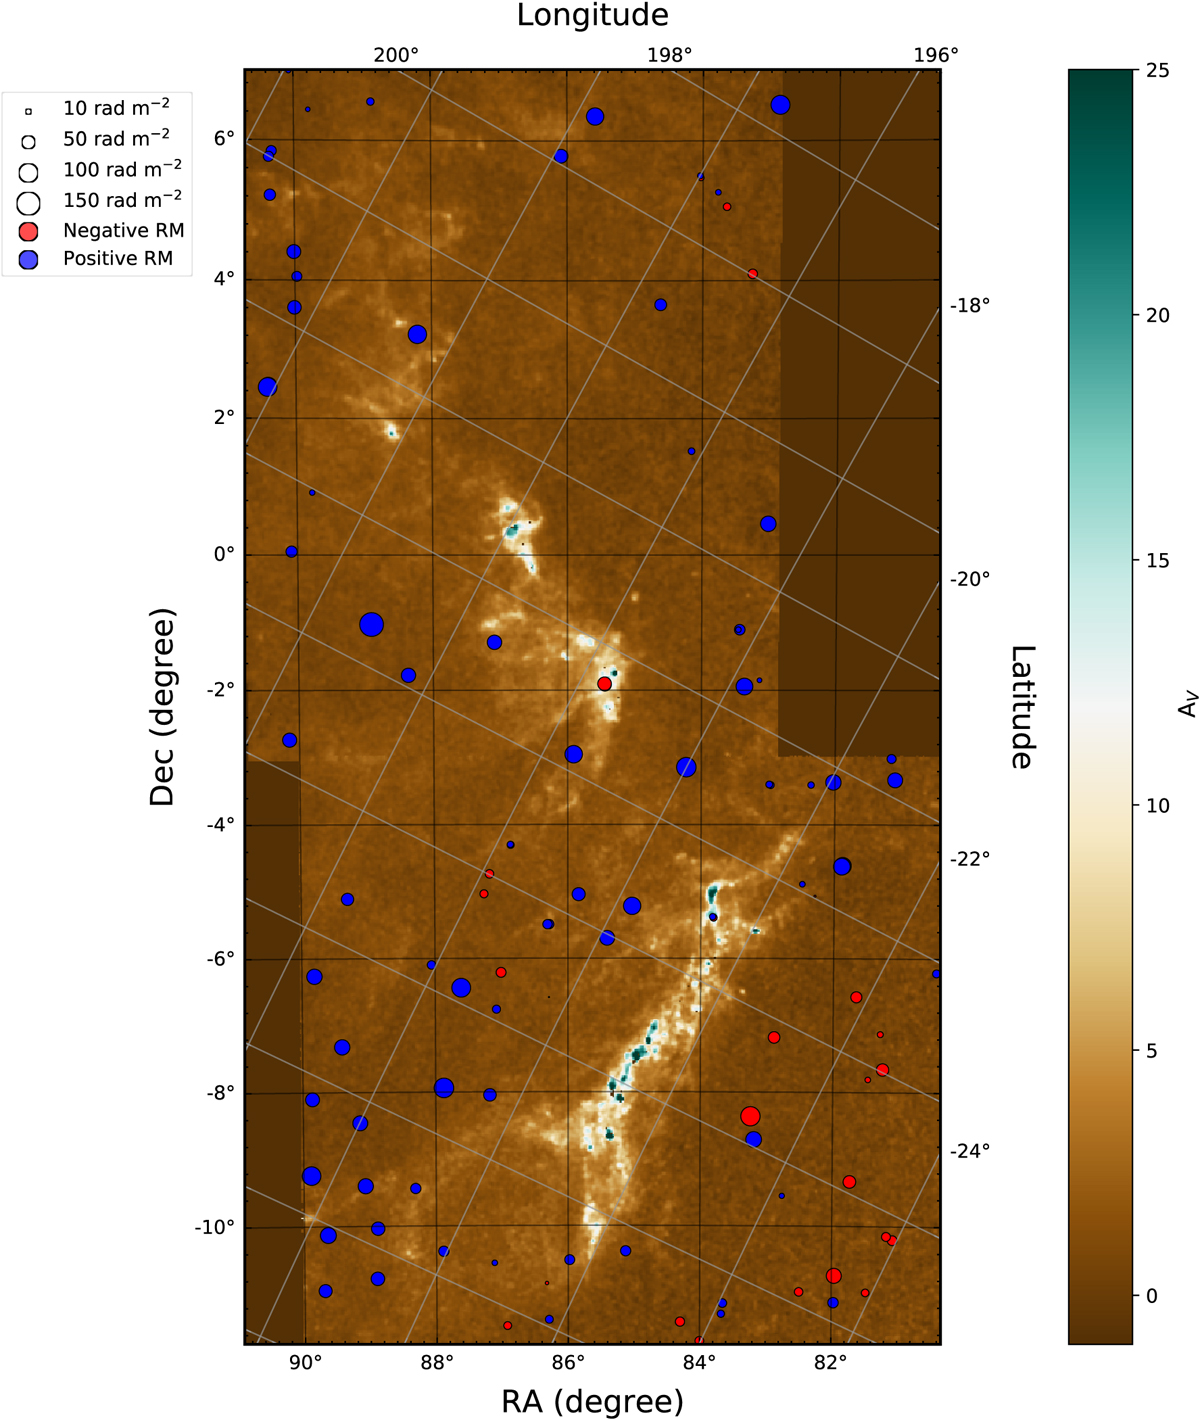
RM values from the catalog of TSS09 mapped on the extinction map of Orion. OMC-A is the complex to the south and OMC-B is the complex to the north. Blue (red) circles indicate positive (negative) RM values. The size of the circles is proportional to the magnitude of the RM. The gray grid provides galactic coordinates, whereas the black grid provides equatorial coordinates. Color image shows the extinction map (AV) in units of magnitudes of visual extinction provided by KBHP09.
Current usage metrics show cumulative count of Article Views (full-text article views including HTML views, PDF and ePub downloads, according to the available data) and Abstracts Views on Vision4Press platform.
Data correspond to usage on the plateform after 2015. The current usage metrics is available 48-96 hours after online publication and is updated daily on week days.
Initial download of the metrics may take a while.