Fig. 9
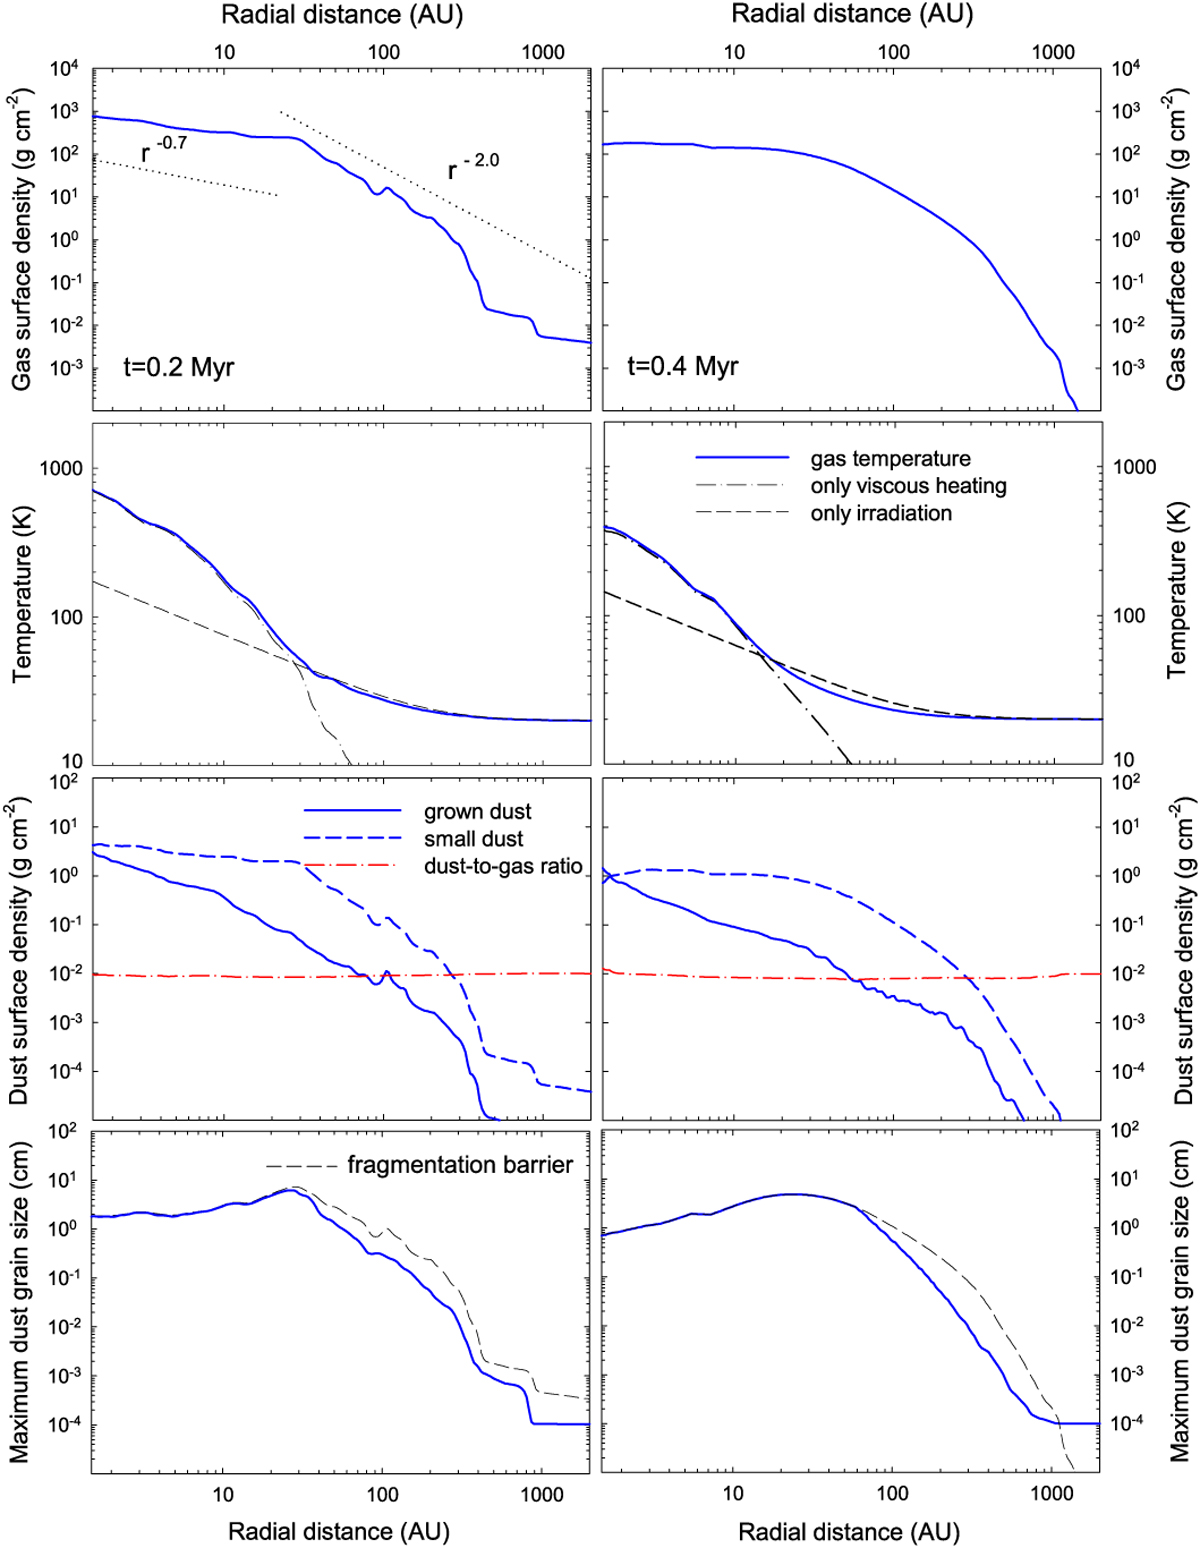
Azimuthally averaged radial profiles of the gas surface density (blue solid lines, top row), gas midplane temperature (blue solid lines, second row), surface densities of small and grown dust (blue dashed and solid lines, third row), and maximum radius of grown dust (blue lines, bottom row) at two evolutionary times: t = 0.2 Myr (left column) and t = 0.4 Myr (right column). The dotted lines present various dependencies on radial distance r to facilitate comparison. The black dashed and dash-dotted lines in the second row show the gas midplane temperatures that would be expected in the presence of either stellar + background irradiation or viscous heating only, respectively. The red dash-dotted lines in the third row are the total dust-to-gas mass ratio. Finally, the black dashed lines in the bottom row present the fragmentation barrier.
Current usage metrics show cumulative count of Article Views (full-text article views including HTML views, PDF and ePub downloads, according to the available data) and Abstracts Views on Vision4Press platform.
Data correspond to usage on the plateform after 2015. The current usage metrics is available 48-96 hours after online publication and is updated daily on week days.
Initial download of the metrics may take a while.