Fig. 6
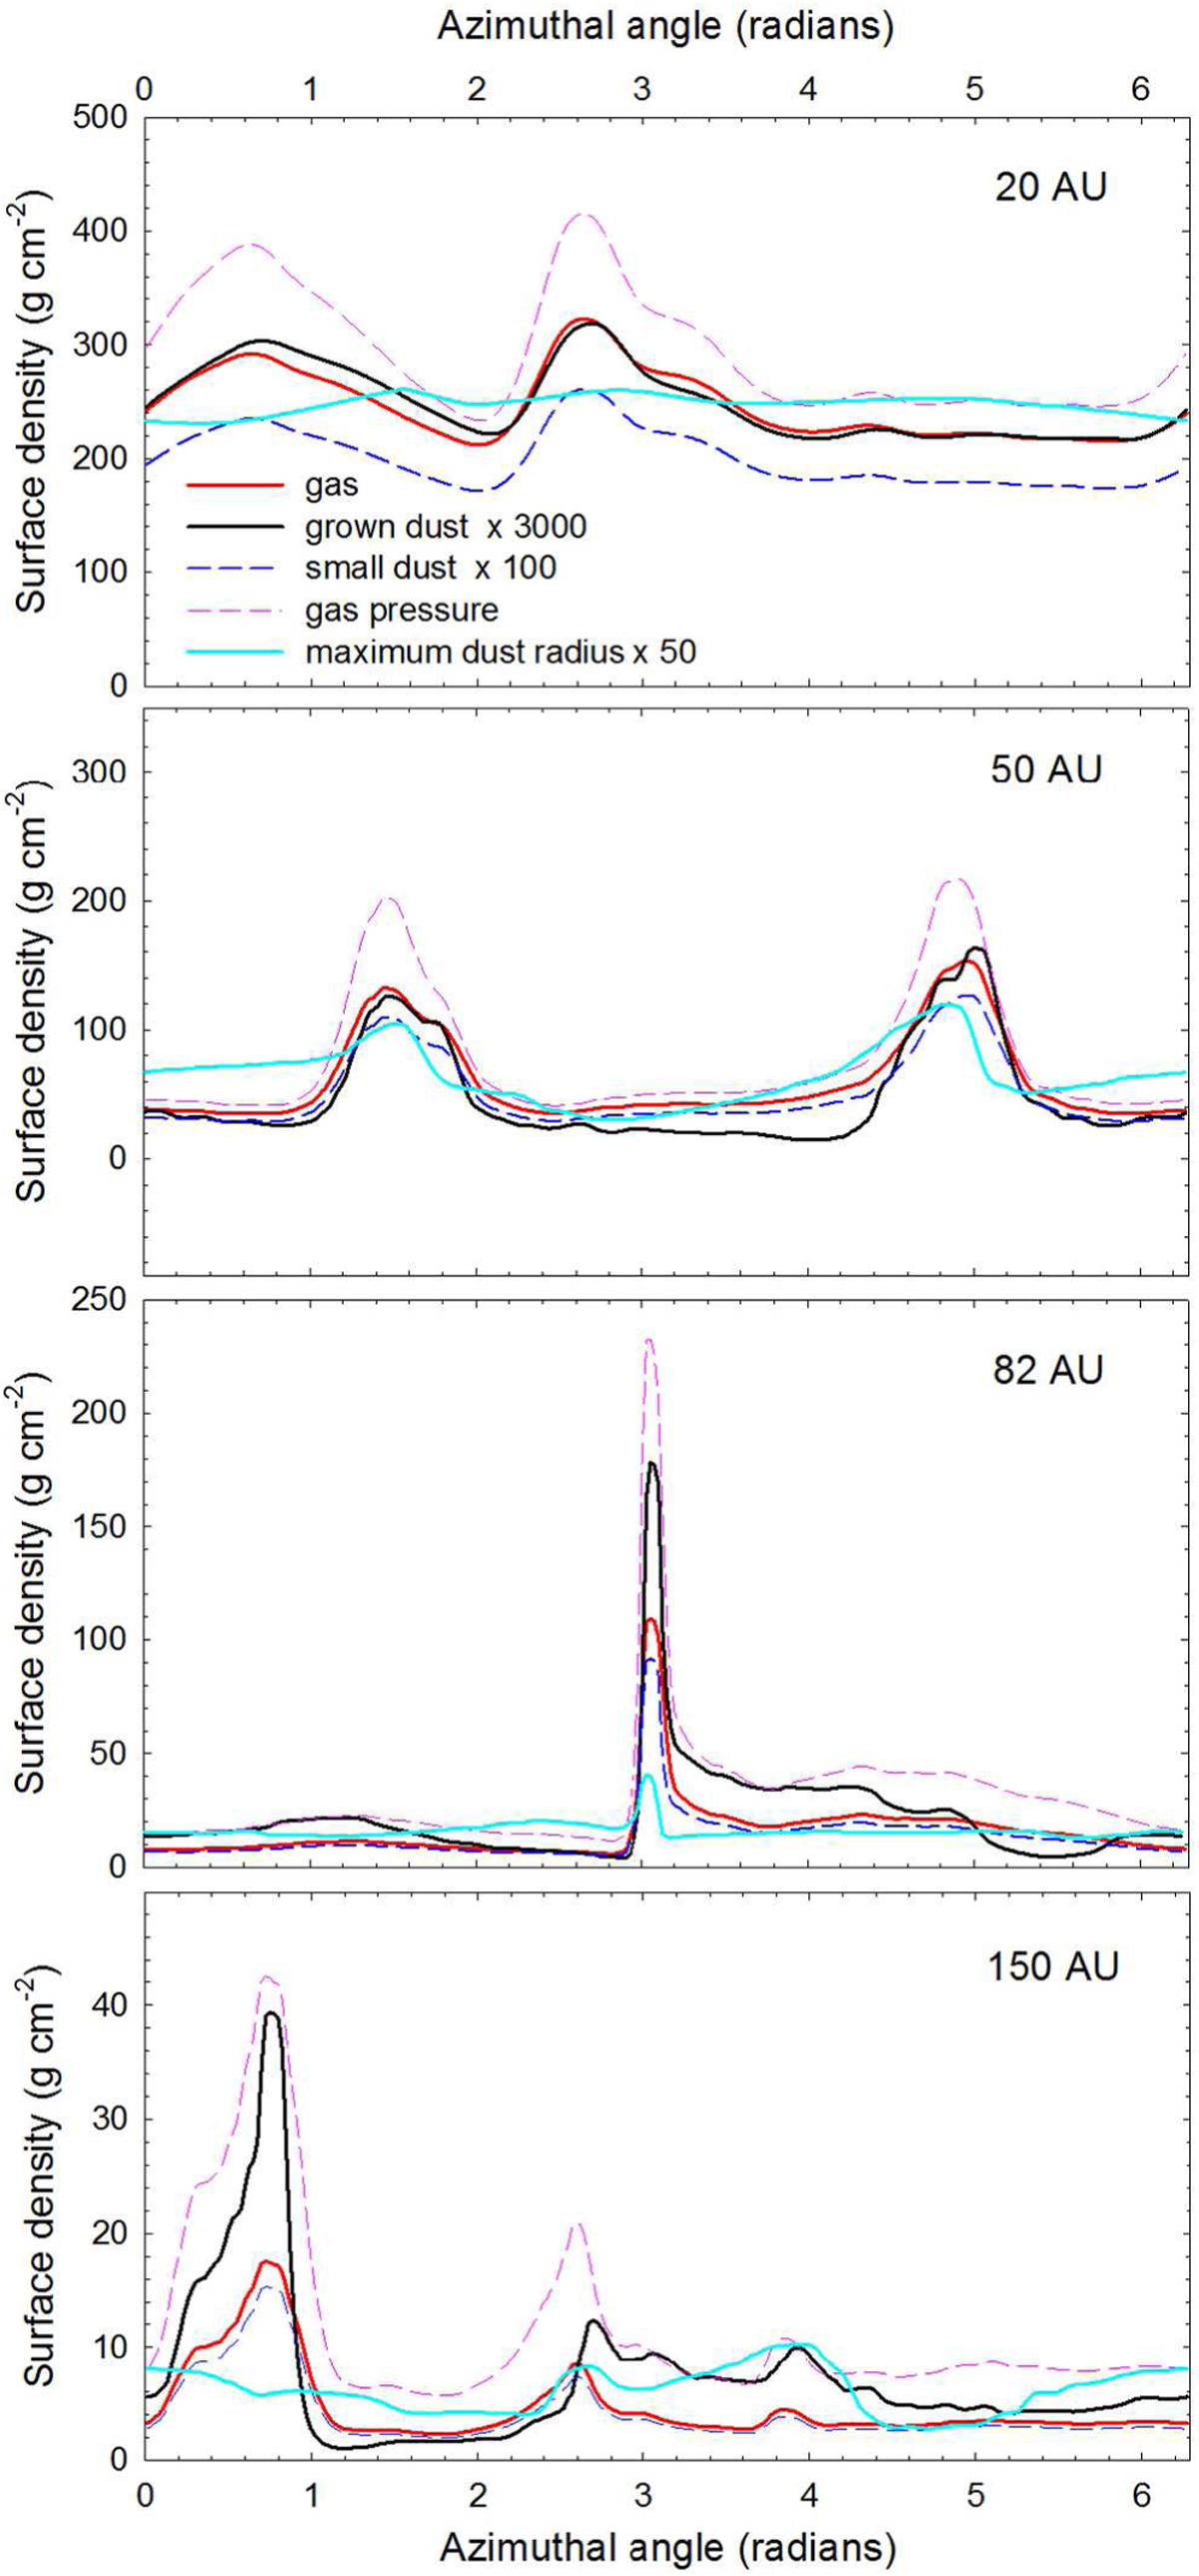
Surface densities of gas (red solid lines), small dust (blue dashed lines), and grown dust (black solid lines) taken along the azimuthal cuts at different distances from the star: r = 20 AU, r = 50 AU, r = 82 AU, and r = 150 AU. The dashed pink and solid cyan lines show the gas pressure (in the code units) and the maximum radius of dust grains ar (in cm) taken along the same cuts. The evolution time is t = 0.2 Myr. We applied different scaling factors for the small dust density, grown dust density, and maximum dust radius.
Current usage metrics show cumulative count of Article Views (full-text article views including HTML views, PDF and ePub downloads, according to the available data) and Abstracts Views on Vision4Press platform.
Data correspond to usage on the plateform after 2015. The current usage metrics is available 48-96 hours after online publication and is updated daily on week days.
Initial download of the metrics may take a while.