Fig. 4
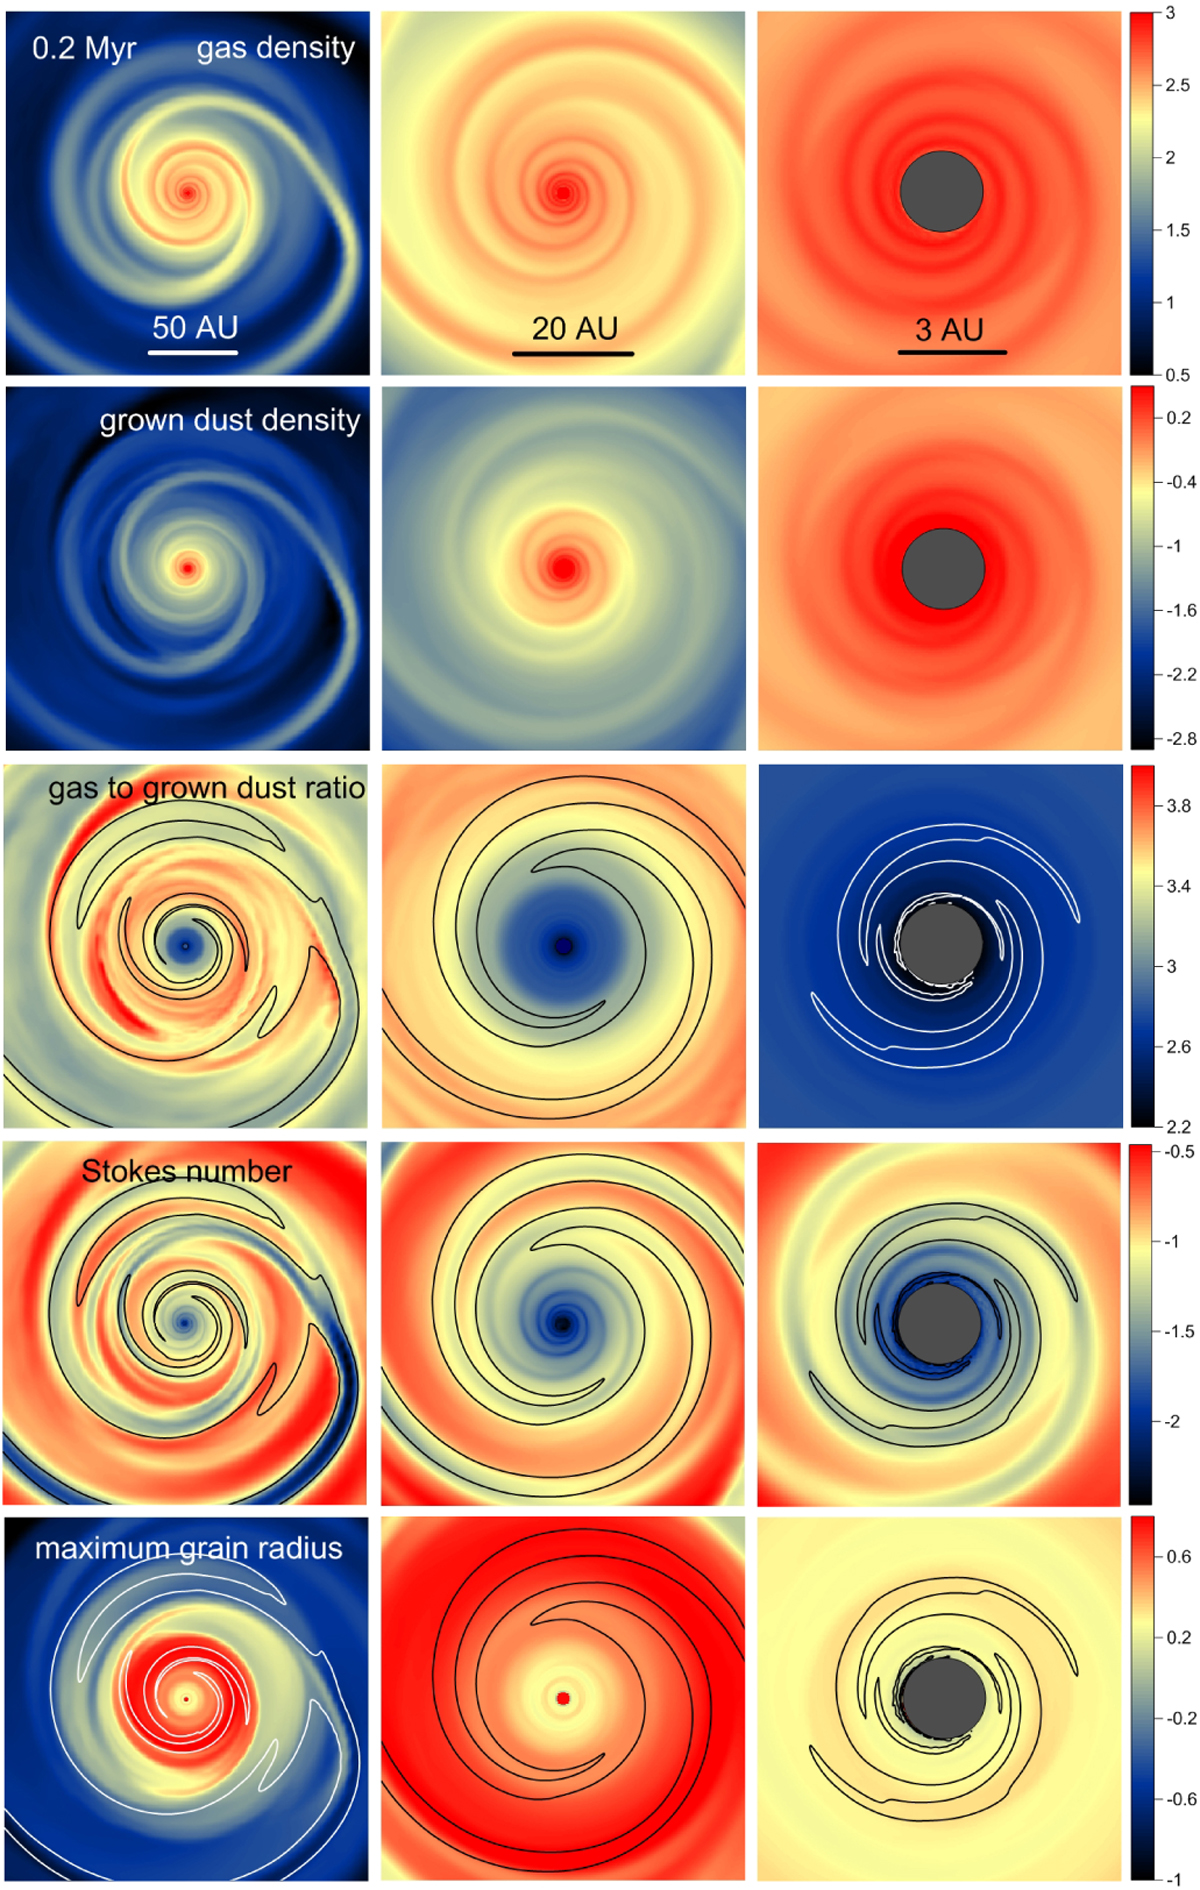
Zoom-in onto the inner disk regions at t = 0.2 Myr: left column –200 × 200 AU2, middle column – 60 × 60 AU2, and right column – 10 × 10 AU2. Shown are the gas surface density in log g cm−2 (top row), grown dust surface density in log g cm−2 (second row), gas-to-grown dust mass ratio in log scale (third row), Stokes number in log scale (fourth row), and maximum radius of dust grains ar in log cm. The contour lines in the third, fourth, and fifth rows delineate the spiral pattern in the gas surface density for convenience.
Current usage metrics show cumulative count of Article Views (full-text article views including HTML views, PDF and ePub downloads, according to the available data) and Abstracts Views on Vision4Press platform.
Data correspond to usage on the plateform after 2015. The current usage metrics is available 48-96 hours after online publication and is updated daily on week days.
Initial download of the metrics may take a while.