Fig. 14
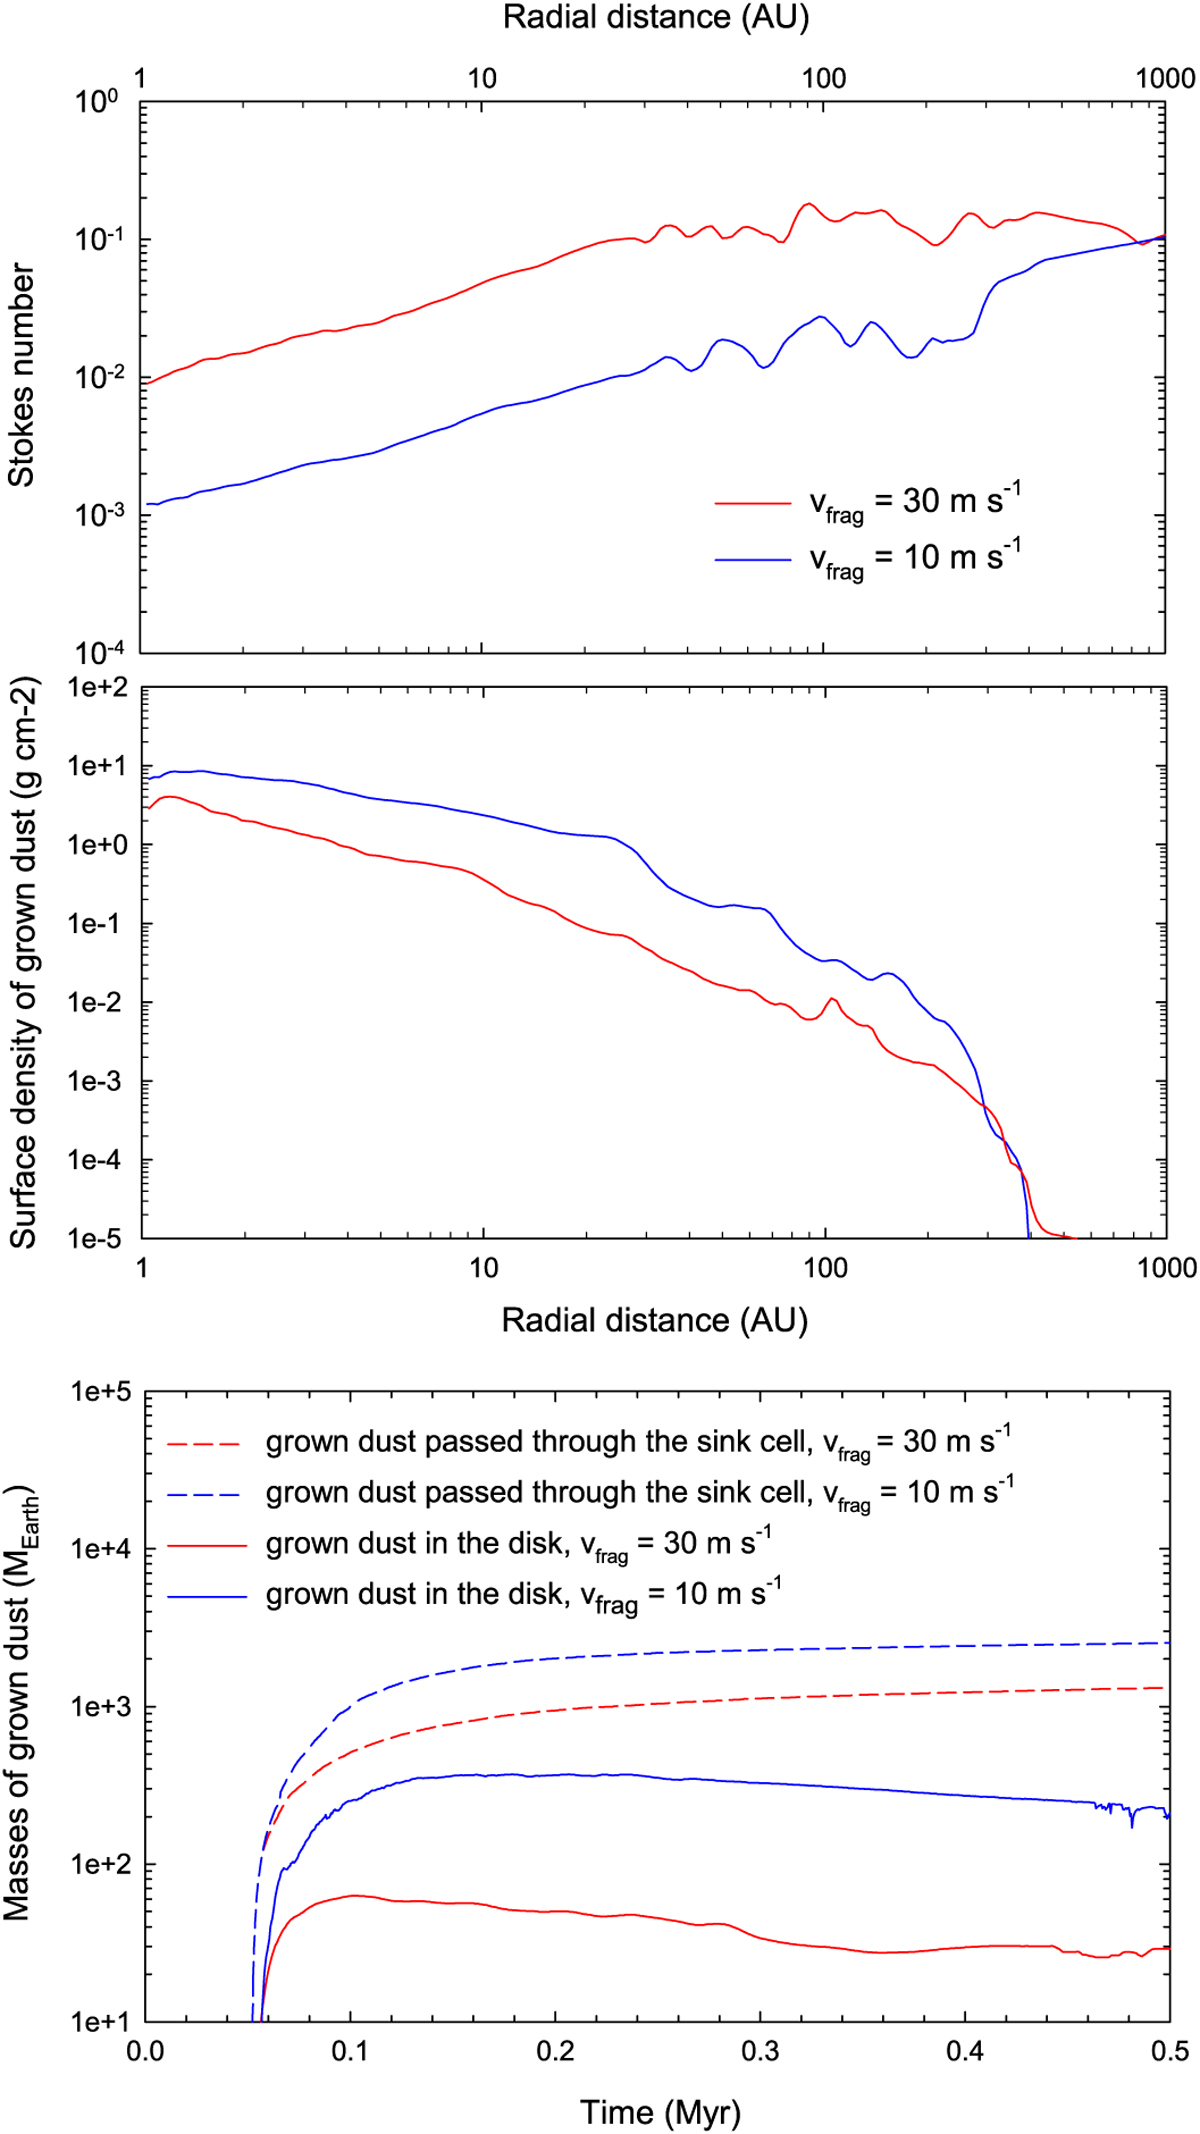
Azimuthally averaged profiles of the Stokes number (top panel), surface density of grown dust (middle panel), and integrated masses of grown dust that passed through the sink cell and remaining in the disk (bottom panel) in models with vfrag = 10 m s−1 (blue lines) and vfrag = 30 m s−1 (red lines). The radial profiles of Σd,gr and St are taken at t = 0.2 Myr.
Current usage metrics show cumulative count of Article Views (full-text article views including HTML views, PDF and ePub downloads, according to the available data) and Abstracts Views on Vision4Press platform.
Data correspond to usage on the plateform after 2015. The current usage metrics is available 48-96 hours after online publication and is updated daily on week days.
Initial download of the metrics may take a while.