Fig. 11
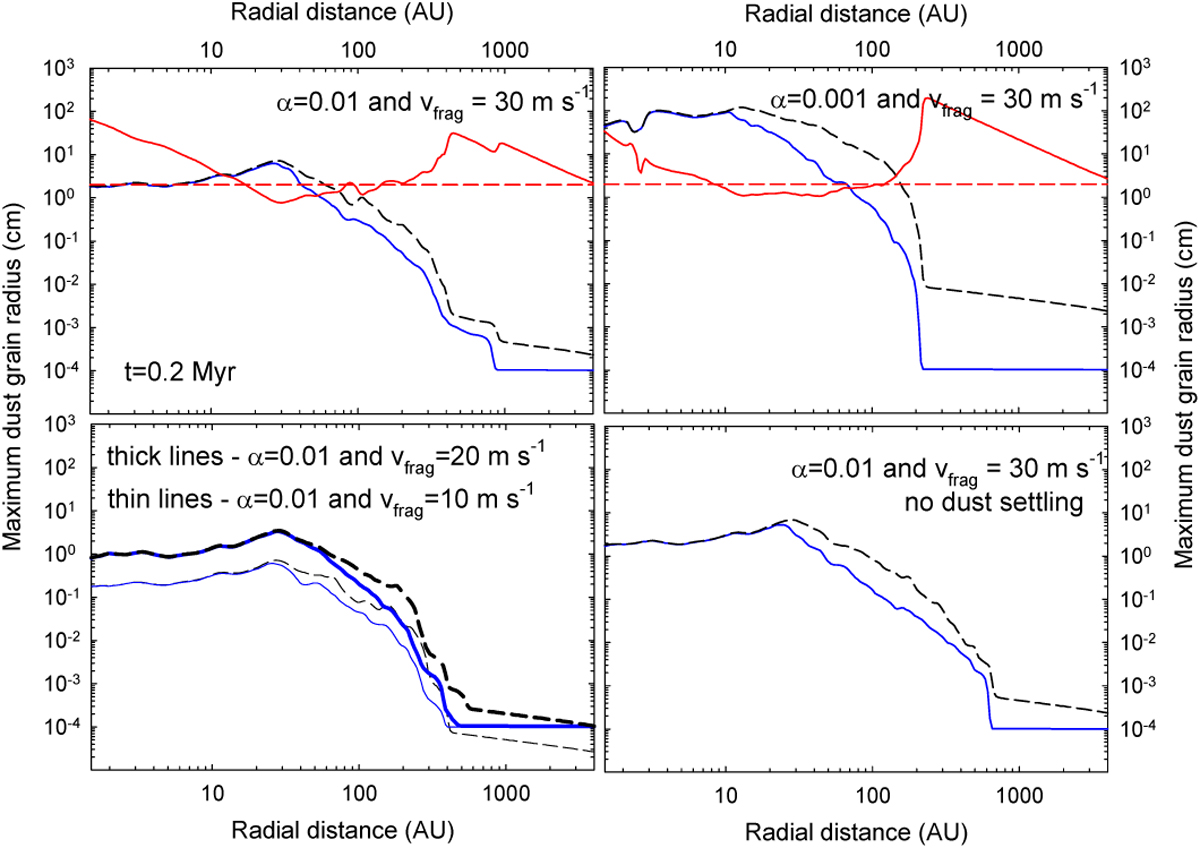
Azimuthally averaged radial profiles of the maximum radius ar in models with different α-parameters and fragmentation velocities as indicated in the panels. The evolution time in all panels is t = 0.2 Myr. The solid blue lines are the model results, and the dashed black lines are the maximum grain radius afrag set by the fragmentation barrier defined in Eq. (26). The red solid lines show the Toomre Q-parameter calculated using Eq. (33). The red dashed lines mark the Q = 2.0 threshold for convenience.
Current usage metrics show cumulative count of Article Views (full-text article views including HTML views, PDF and ePub downloads, according to the available data) and Abstracts Views on Vision4Press platform.
Data correspond to usage on the plateform after 2015. The current usage metrics is available 48-96 hours after online publication and is updated daily on week days.
Initial download of the metrics may take a while.