Fig. 10
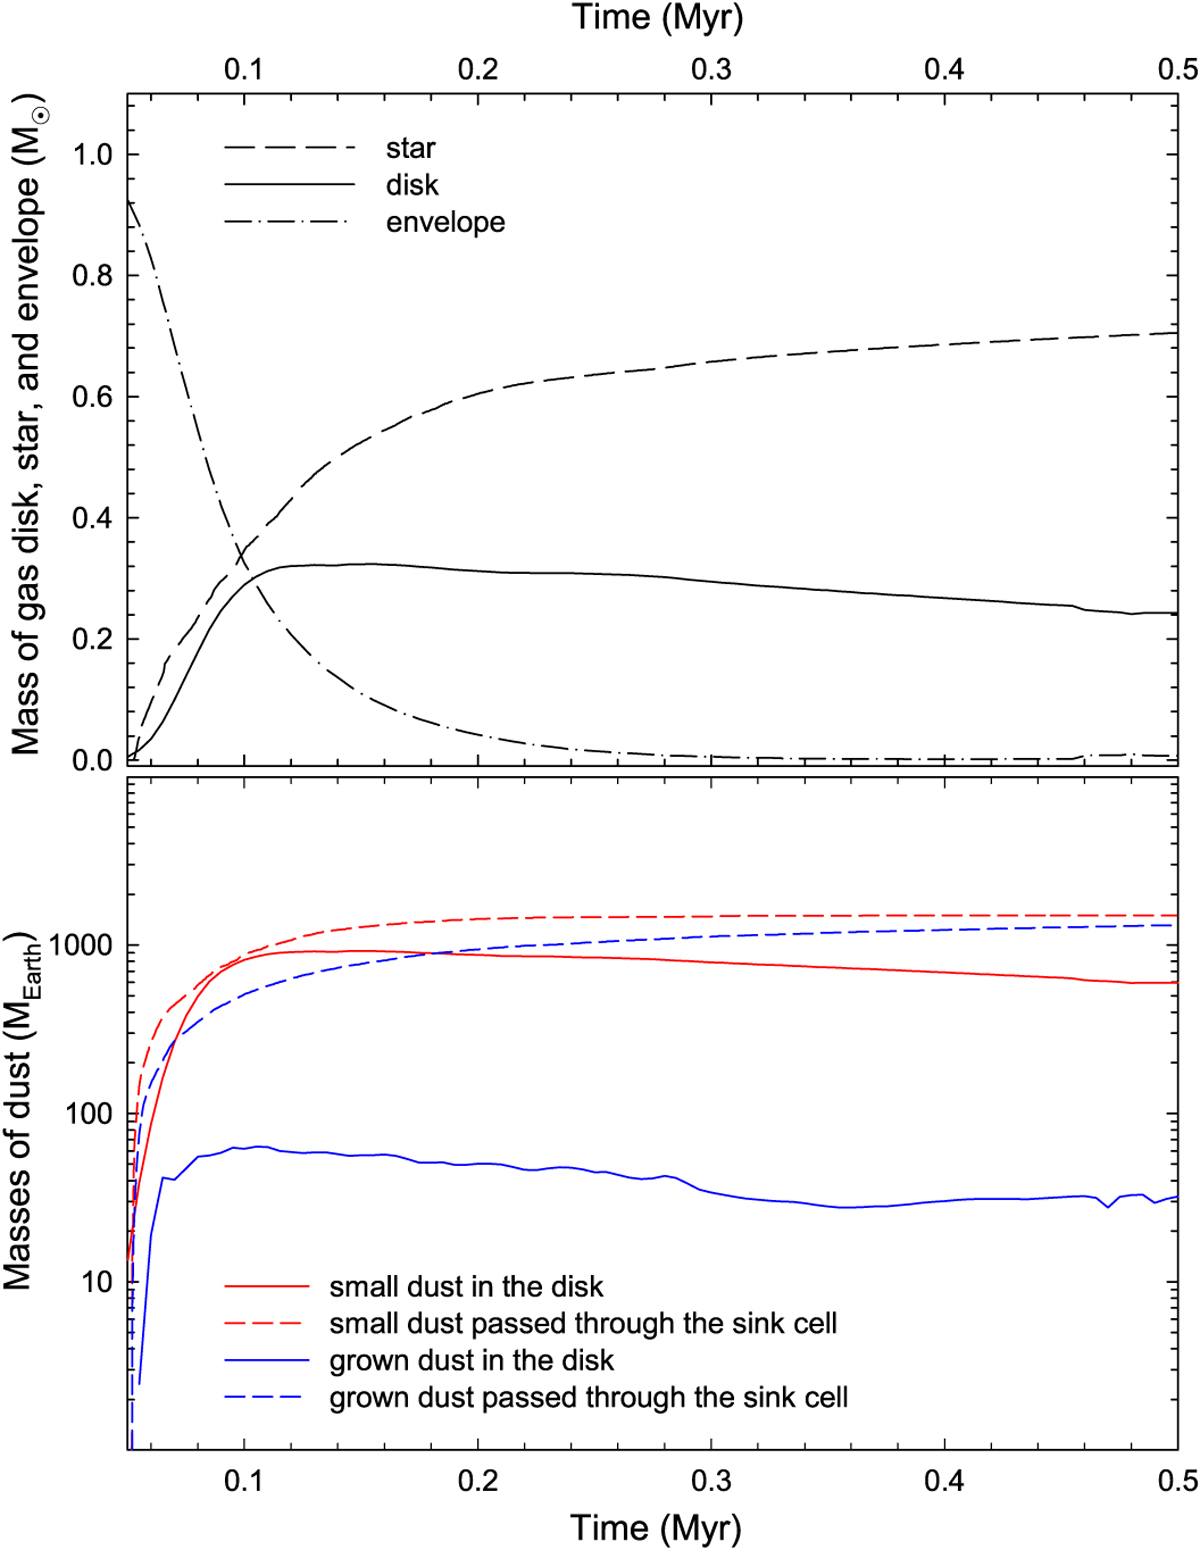
Toppanel: integrated masses of the disk and envelope (solid and dash-dotted line) and the mass of the central star (dashed line) as a function of time. Bottom panel: total masses of the grown dust (blue solid line) and small dust (red solid line) in the disk as a function of time. We also show the masses of small and grown dust that passed through the sink cell (red dashed and blue dashed lines, respectively).
Current usage metrics show cumulative count of Article Views (full-text article views including HTML views, PDF and ePub downloads, according to the available data) and Abstracts Views on Vision4Press platform.
Data correspond to usage on the plateform after 2015. The current usage metrics is available 48-96 hours after online publication and is updated daily on week days.
Initial download of the metrics may take a while.