Fig. 1
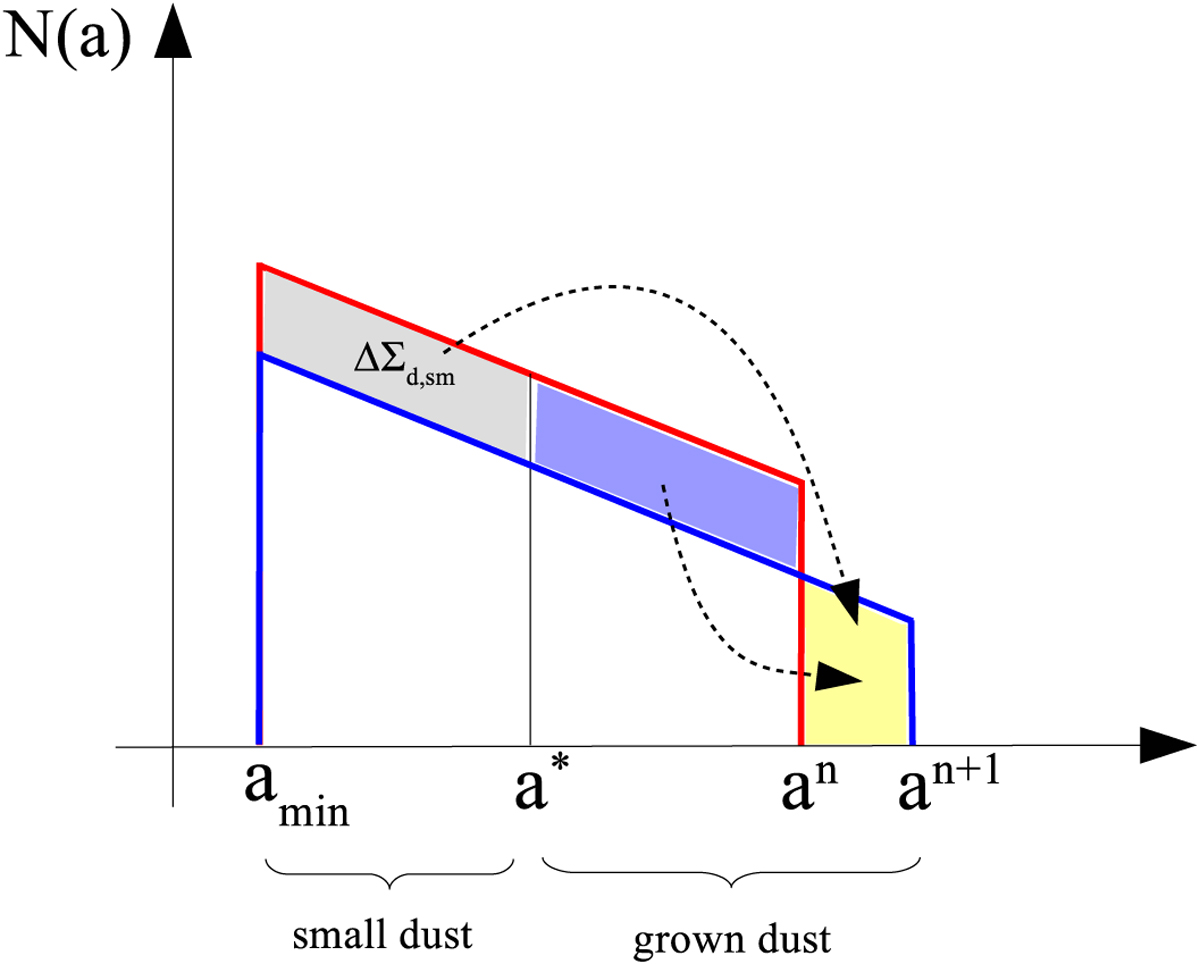
Illustration of the adopted scheme for dust growth. The size distributions of dust grains at the current
n
and next n + 1 time steps are shown with the red and blue lines, respectively. Here, amin
is the minimum radius of small dust grains, while ![]() and
and ![]() are the maximum radii of the grown dust at the current and next time step. Both distributions are assumed to have the same power-law index. The gray area represents the amount of small dust
Δ Σd ,sm
(per surface area) converted into grown dust during one hydrodynamic time step
Δ t. The blue area between a*
and an is also transferred above an, but this operation does not change the total mass of grown dust.
are the maximum radii of the grown dust at the current and next time step. Both distributions are assumed to have the same power-law index. The gray area represents the amount of small dust
Δ Σd ,sm
(per surface area) converted into grown dust during one hydrodynamic time step
Δ t. The blue area between a*
and an is also transferred above an, but this operation does not change the total mass of grown dust.
Current usage metrics show cumulative count of Article Views (full-text article views including HTML views, PDF and ePub downloads, according to the available data) and Abstracts Views on Vision4Press platform.
Data correspond to usage on the plateform after 2015. The current usage metrics is available 48-96 hours after online publication and is updated daily on week days.
Initial download of the metrics may take a while.