Fig. 6
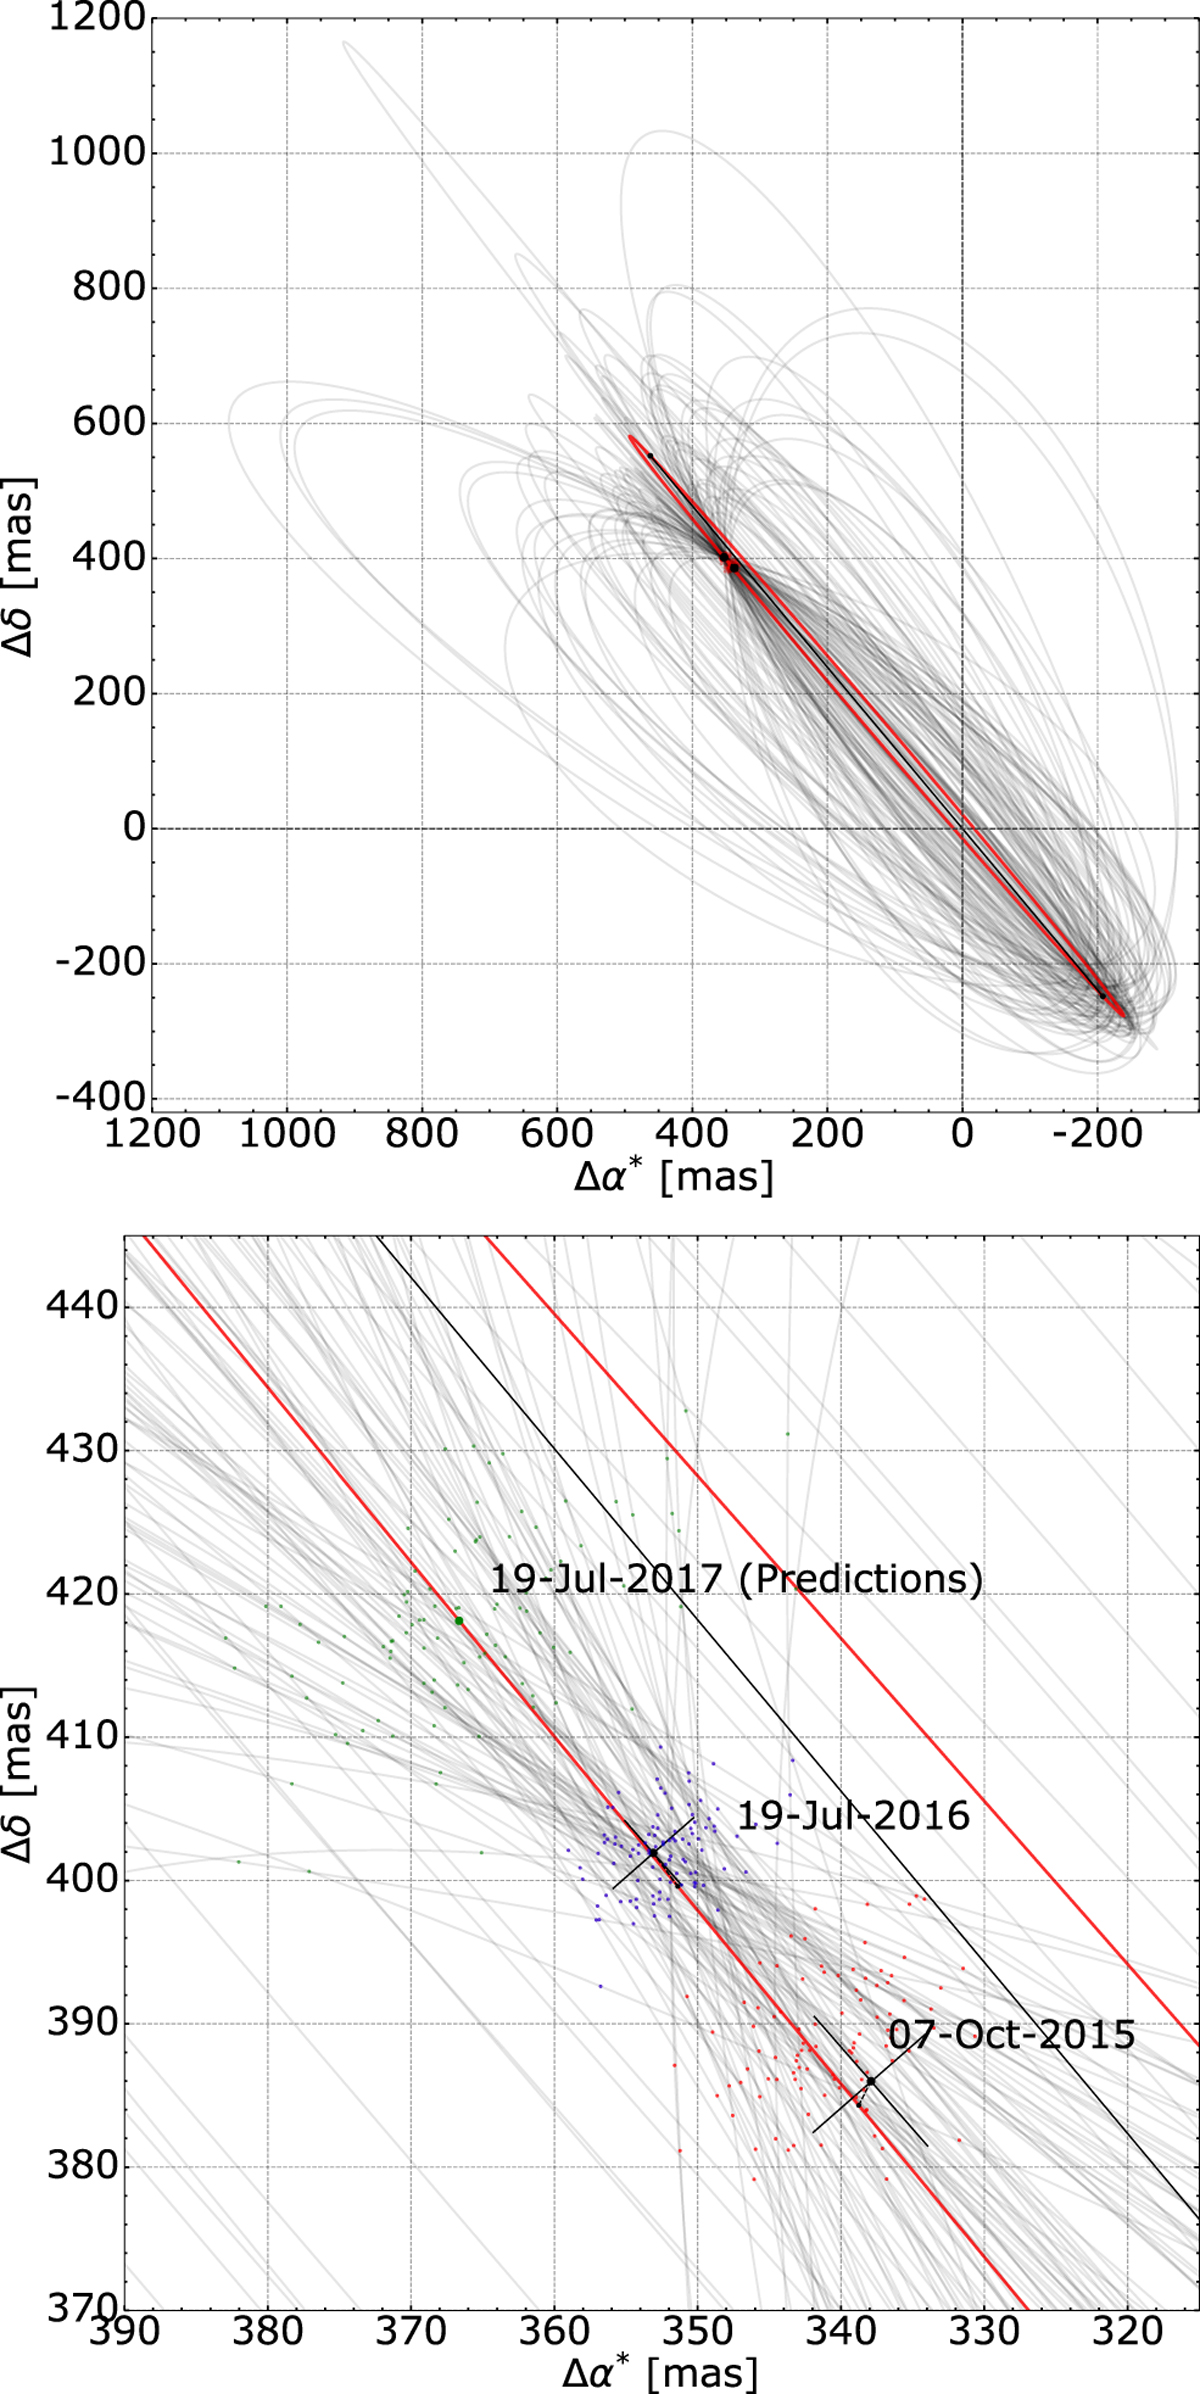
Observed and predicted orbital motion of HD 4113 AC, shown as the relative projected position of HD 4113C. A series of orbits are plotted, drawn from the posterior distribution of the combined RV+imaging analysis. The bold red curve corresponds to the maximum likelihood solution. The bottom panel is a zoom of the orbit, centered on the date of the observations.
Current usage metrics show cumulative count of Article Views (full-text article views including HTML views, PDF and ePub downloads, according to the available data) and Abstracts Views on Vision4Press platform.
Data correspond to usage on the plateform after 2015. The current usage metrics is available 48-96 hours after online publication and is updated daily on week days.
Initial download of the metrics may take a while.