| Issue |
A&A
Volume 613, May 2018
|
|
|---|---|---|
| Article Number | A52 | |
| Number of page(s) | 8 | |
| Section | Stellar structure and evolution | |
| DOI | https://doi.org/10.1051/0004-6361/201732533 | |
| Published online | 31 May 2018 | |
Discovery of X-ray pulsations in the Be/X-ray binary IGR J06074+2205
1
IESL, Foundation for Research and Technology-Hellas,
71110
Heraklion, Greece
2
Physics Department, University of Crete,
71003
Heraklion, Greece
e-mail: This email address is being protected from spambots. You need JavaScript enabled to view it.
3
Harvard-Smithsonian Center for Astrophysics,
60 Garden Street,
Cambridge,
MA
02138, USA
Received:
22
December
2017
Accepted:
12
February
2018
Abstract
Context. IGR J06074+2205 is a poorly studied X-ray source with a Be star companion. It has been proposed to belong to the group of Be/X-ray binaries (BeXBs). In BeXBs, accretion onto the neutron star occurs via the transfer of material from the Be star’s circumstellar disk. Thus, in the absence of the disk, no X-ray should be detected.
Aims. The main goal of this work is to study the quiescent X-ray emission of IGR J06074+2205 during a disk-loss episode.
Methods. We obtained light curves at different energy bands and a spectrum covering the energy range 0.4–12 keV. We used Fourier analysis to study the aperiodic variability and epoch folding methods to study the periodic variability. Model fitting to the energy spectrum allowed us to identify the possible physical processes that generated the X-rays.
Results. We show that at the time of the XMM-Newton observation, the decretion disk around the Be star had vanished. Still, accretion appears as the source of energy that powers the high-energy radiation in IGR J06074+2205. We report the discovery of X-ray pulsations with a pulse period of 373.2 s and a pulse fraction of ~50%. The 0.4–12 keV spectrum is well described by an absorbed power law and blackbody components with the best fitting parameters: NH = (6.2 ± 0.5) × 1021 cm−2, kTbb = 1.16 ± 0.03 keV, and Γ = 1.5 ± 0.1. The absorbed X-ray luminosity is LX = 1.4 × 1034 erg s−1 assuming a distance of 4.5 kpc.
Conclusions. The detection of X-ray pulsations confirms the nature of IGR J06074+2205 as a BeXB. We discuss various scenarios to explain the quiescent X-ray emission of this pulsar. We rule out cooling of the neutron star surface and magnetospheric emission and conclude that accretion is the most likely scenario. The origin of the accreted material remains an open question.
Key words: stars: emission-line, Be / X-rays: binaries / stars: neutron
© ESO 2018
1 Introduction
IGRJ06074+2205 was discovered by INTEGRAL/JEM-X during public observations of the Crab region that took place on 15 and 16 February 2003 (Chenevez et al. 2004). The source was detected with a flux of ~22 mCrab (±2 mCrab) in the energy range 3–20 keV. To localize the X-ray source and determine the correct counterpart, Tomsick et al. (2006) obtained a 5 ks observation with the Chandra X-ray Observatory on 2 December 2006. The Chandra flux was 2 × 10⁻¹² erg cm−2 s−1 in the energy range 0.3–10 keV. The energy spectrum could be fitted with an absorbed power-law with NH = (6 ± 2) × 1022 cm−2 and a photon index of 1.3 ± 0.8 (90% confidence errors). The absorbed flux was nearly 60 times lower than the value at the time of the INTEGRAL observation. The Chandra observation also allowed the confirmation of the Be star suggested by Halpern & Tyagi (2005) as the correct optical counterpart.
Optical spectroscopic observations performed between 2006 and 2010 revealed a fast-rotating (vsini ≈ 260) B0.5Ve star located at ~4.5 kpc (Reig et al. 2010). The star displayed variability in the Hα line on timescales of months. Changes were seen both in the line profile and the line intensity. Even though X-ray pulsations were not detected, the available data suggested that IGR J06074+2205 is a Be/X-ray binary (BeXB). BeXBs constitute the most numerous subgroup of high-mass X-ray binaries and consist of a Be star and a neutron star (Paul & Naik 2011; Reig 2011). The mass donor in these systems is a relatively massive (≳10 M⊙) and fast-rotating (≳80% of break-up velocity) star, whose equator is surrounded by a disk formed from photospheric plasma ejected by the star. Hα in emission is typically the dominant feature in the spectra of Be stars and the reason for the letter “e” in the spectral type identification. In addition to emission lines, Be stars also show variable polarized light and infrared excess, i.e., more near-IR emission than a normal B-type star of the same spectral type. The disk forms and dissipates on timescales of years. Because the physicalconditions in the disk change substantially during the formation and dissipation phases, so do the Hα intensity and the optical and infrared photometric colors. Thus the disk is responsible for the long-term optical and infrared variability of the system. Also, since the main source of matter available for accretion is the circumstellar disk, also known as the decretion disk, the X-ray variability is expected to be closely linked to the state of the disk. In particular, when the disk disappears completely, the mass transfer toward the neutron star should halt and the X-ray emission should cease. However, at least three systems have shown X-ray emission during disk-loss phases: 1A 0535+262 (Negueruela et al. 2000), IGR J21343+4738 (Reig & Zezas 2014), and SAX J2103.5+4545 (Reig et al. 2014). All three show X-ray pulsations during these observations. In addition, many more sources have been detected in a quiescent state at luminosities LX ≲ 1034 erg s−1 (Tsygankov et al. 2017b). The origin of the X-ray emission and of the accreted material in this state remain unknown.
In this work, we present an X-ray analysis during one of these disk-loss episodes giving us the rare opportunity to study a BeXB in the quiescent phase where the reservoir of accretion gas is exhausted. We report the discovery of X-ray pulsations with a spin period of 373.2 s.
2 Observations
2.1 X-ray band
IGR J06074+2205 was observed by XMM-Newton on 29 September 2017 during revolution 3261. The observation (ObsID 0794581301) started at 11:49 h UT and lasted for ~40 ks. The XMM-Newton Observatory (Jansen et al. 2001) includes three 1500 cm2 X-ray telescopes each with a European Photon Imaging Camera (EPIC) at the focus. Two of the EPIC imaging spectrometers use metal oxide semi-conductor (MOS) CCDs (Turner et al. 2001) and one uses pn-CCDs (Strüder et al. 2001). Reflection Grating Spectrometers (den Herder et al. 2001) are located behind two of the telescopes while the 30-cm optical monitor (OM) instrument has its own optical/UV telescope (Mason et al. 2001). Data were reduced using the XMM-Newton Science Analysis System (SAS version 16.1).
Prior to the extraction of the data products, we processed the observation data files (ODFs) to obtain calibrated and concatenated event lists. We filtered the event-list file to extract EPIC-pn events with a pixel pattern in the range 0–4 (single and doubles) and EPIC-MOS events with patterns 0–12. For the spectral analysis, we used the more strict selection criterion FLAG=0, which omits parts of the detector area like border pixels and columns with higher offset. The first 16 240 s are affected by flaring particle background and were discarded for the spectral analysis. For the timing analysis, we performed a barycentric correction, that is, the arrival time of the photons was shifted to the barycentre of the solar system. To generate the light curves and spectrum, we extracted events from a circular region with radius 40 arcsec. This size is the maximum allowed to avoid including the CCD edge. It includes more than 90% of the encircled energy of 1.5 keV photons. To select the background region, we chose a region of the same size ~2 arcmin away from the source.
The EPIC instruments were used in the full frame mode. In this mode, all pixels of all CCDs are read out and thus the full field of view is covered. The highest possible time resolution in this mode is 73.4 ms for EPIC-pn and 2.6 s for MOS. IGR J06074+2205 is the brightest source detected in the field of view. The source region is free of pile-up as demonstrated by the fact that the observed distribution of counts as a function of the PI channel of single and double events agrees with the expected one. Using the SAS task epatplot we find that the 0.5–2.0 keV observed-to-model singles and doubles pattern fractions ratios are consistent with 1.0 within statistical errors (0.992 ± 0.027 and 1.011 ± 0.038 for single and double events, respectively).
We mainly used data from the EPIC-pn camera because it is the instrument with the highest effective area and the highest time resolution. Nevertheless, we checked that we obtained consistent results with different cameras.
2.2 Optical band
We observed the source with the OM/XMM-Newton in the fast mode. We extracted light curves with a total duration of 2000 s for bands U, B, and V and 8800 s for UV bands UV W1 (λeff = 291 nm), UV W2 (λeff = 212 nm), and UV M2 (λeff= 231 nm). Timing analyses on each of these light curves did not reveal any variability. The average magnitudes are: U = 12.43, B = 13.04, and V = 12.34.
The spectroscopic observations were made with the 1.3 m telescope of the Skinakas Observatory (Crete, Greece). We used 2048 × 2048 13.5 μm pixel ANDOR IKON and a 1302 l mm−1 grating, giving a nominal dispersion of ~0.94 Å pixel−1. Spectra of comparison lamps were taken before each exposure in order to account for small variations of the wavelength calibration during the night. To ensure an homogeneous processing of the spectra, they were normalized with respect to the local continuum, which was rectified to unity by employing a spline fit. A disk-loss episode is identified when the Hα line reverts from emission into absorption. In the absence of the disk, we expect to observe the typical photospheric absorption line of an early-type star. We report here spectroscopic observations taken close in time to the XMM-Newton observation. For a long-term optical variability study of the source see Reig et al. (2016).
3 Results
The optical/IR emission lines in Be stars arise from radiative processes in the disk. In particular, the Hα line is optically thick and formed by recombination. It is the strongest feature and forms over a large region of the disk at its outermost parts. Consequently, Hα emission should disappear when the disk dissipates. The most common way to quantify the strength of the line is the equivalent width. Negative values indicate emission profiles, while positive values correspond to absorption dominated profiles, i.e., with the absence of the disk. Positive values of the EW(Hα) between 0 and the expected value of a purely photospheric line, for example, ≈+3.5 Å for B0.5V Be star (Jaschek & Jaschek 1987), indicate that the line is partially filled with emission.
Figure 1 displays three Hα line profiles of IGR J06074+2205 at different epochs. The top and middle panels show the Hα line 17 days before (12 September 2017) and 15 days after (13 October 2017) the XMM-Newton observation. Both observations show Hα in absorption at a level of EW(Hα) = +2.3Å, indicating that the disk had vanished at the time of the X-ray observation, although some weak residual emission cannot be completely ruled out. In fact, the most recent observation, in November 2017 showed EW(Hα) = −0.7 Å (bottom panel in Fig. 1), suggesting that the disk has begun to form again.
3.1 Discovery of X-ray pulsations
Although the material that feeds the neutron star was exhausted, X-ray emission from IGR J06074+2205 is clearly detected. To investigate the X-ray variability, we extracted a 1 s binned light curve in the energy range 0.4–12 keV.
The average 0.4–12 keV source count rate after background subtraction was 0.970± 0.006 counts s−1. The average background rate for the entire 38.8 ks observation was 0.036± 0.001 counts s−1, but it was larger at the beginning of the observation owing to enhanced flaring particle background. The average background count rate during the first 16 ks was 0.062± 0.002 counts s−1, while for the rest of the observation it remained at 0.017± 0.001 counts s−1. The X-ray light curve exhibited moderate variability on time scales of a few kiloseconds. The root-mean-square measured in the 1 s binned light curve was 43 ± 1%.
To search for pulsations, we run a fast Fourier transform (FFT) and produce a Leahy-normalized (Leahy et al. 1983) power spectrum covering the frequency interval 3.05 × 10⁻⁵–0.5 Hz in 32768 bins (Fig. 2). Three peaks are clearly seen in the power spectrum at ν1 = 0.002679 Hz, ν2 = 0.005356 Hz, and ν3 = 0.008039 Hz. All peaks are significant above 5 σ level, indicating that there is a distinct periodic signal in the data. Because there is a strong red noise component (see Sect. 3.2), the power spectrum was normalized to unity and the result multiplied by 2. In this way we ensure that the power spectral continuum agrees with the expected white noise power in the Leahy normalization (Leahy et al. 1983; Leahy 1987). This is a necessary step prior to the calculation of the significant level.
The power of the lowest frequency peak is distributed over several bins, making this peak appear less significant than the second peak. However, the ratios of the peak frequencies imply that the second peak cannot represent the fundamental frequency. If ν2 was the fundamental frequency then ν3 would be the first harmonic, hence ν3∕ν2 = 2. Clearly, ν3∕ν2≠2. In contrast, if ν1 is the main periodicity, then ν2∕ν1 = 2 and ν3 ∕ν1 = 3 as indeed it is the case. Therefore ν2 and ν3 are the first and second harmonics of the main signal ν1 at 0.002685 Hz. This frequency corresponds to a period of ~372.4 s.
We also searched for periodic signal using an epoch-folding technique where the data is folded over a period range (Leahy 1987; Larsson 1996). For each trial period, the χ2 statistic is calculated. If the data contain a periodic signal, then a peak stands out in the χ2 − Ptrial plot. We used thetask efsearch of the XRONOS package and found a best-fit period at 373.2 s (Fig 2, lower panel).
To improve the estimation of the pulse period, we next applied a phase fitting technique. We divided the light curve into 8 segments, each with a length equal to 12 pulse periods approximately and calculated a folded pulse profile for each segment with a common epoch and period. These profiles were cross-correlated with a template obtained by folding the entire light curve onto the trial period. The resulting phase delays were fitted with a linear function, whose slope provides thecorrection needed to be applied to the trial period. We then adjusted the period and repeated the procedure until the phase delay exhibited no net trend with time throughout the observation. The best-fit period was 373.226 ± 0.013 s, where the error was estimated from the uncertainty on the first-order term of a linear fit to the phase delays.
Next, we extracted light curves at various energy bands and folded the best-fit pulse period onto these light curves to obtain the pulse profiles (Fig. 3). The pulse profile is complex with a multi-peak structure. The pulse fraction, defined as PF = (Imax − Imin)∕(Imax + Imin), where Imin and Imax are background-corrected count rates at the pulse profile minimum and maximum, does not strongly depend on energy and varies in the range 50–60%.
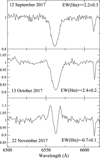 |
Fig. 1 Hα line profile before and after the X-ray observations on 29 September 2017. |
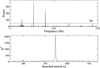 |
Fig. 2 Upper panel: EPIC-pn power spectrum and ~5σ significance level. Lower panel: χ2 maximization after folding the data over a range of periods (epoch folding). |
3.2 Power spectrum
The ability to detect a narrow feature in the power spectrum, i.e., pulsations, is highly reduced when any kind of averaging (adjacent bins or segments) is carried out (van der Klis 1989). This is the reason that we used full time resolution and no segment division in Sect. 3.1 and Fig. 2. However, a study of the peaked and broad-band noise may also be of interest. In this section, we examine the structure of the power spectrum to identify possible noise components.
To obtain the power spectrum shown in Fig. 4, we proceeded as follows: we extracted Δ t s binned lightcurves in the energy range 0.4–12 keV. The light curve was divided into segments of duration T and a Fast Fourier Transform was computed for each segment. The final power spectrum is the average of all the power spectra obtained for each segment. The power spectra were logarithmically rebinned in frequency and normalized such that the integral between two frequencies gives the squared rms fractional variability. The expected white noise level was subtracted. We tried different combinations of Δ t and T and found that above ν ~ 0.1 Hz the power spectrum is white-noise dominated. Therefore, we used Δt = 1 s and T = 8192 s covering a frequency range 0.00012–0.5 Hz.
The power spectrum shows strong red noise. The spectral continuum can be described by two zero-centred Lorentzians with widths 0.0019 ± 0.0006 Hz and 0.023± 0.006 Hz, respectively (reduced χ2 = 1.28 for 98 degrees of freedom) or with a broken power law with indices Γ1 = 0.65 ± 0.05 and Γ2 fixed to 2, and a break at νbreak = 0.024 ± 0.004 Hz (reduced χ2 = 1.26 for 98 degrees of freedom). The spikes caused by the pulse period and its harmonics were fitted with Lorentzian profiles fixed at the expected frequencies. The rms in the frequency range 0.0001–0.1 Hz is 40%.
An interesting feature of the power spectrum is the strong coupling between the periodic and aperiodic variability (see Sect. 4.1), which manifests itself as a broadening at the base of the harmonics (Lazzati & Stella 1997; Burderi et al. 1997) and might be the reason that the power of the fundamental signal is smaller than the harmonics (Fig. 2).
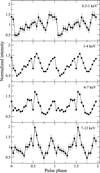 |
Fig. 3 Normalized pulse profiles at different energies. |
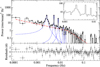 |
Fig. 4 Powerspectrum of IGR J06074+2205 (circles) and model components, which consist of a broken power law (red dashed line)and multi Lorentzian profiles (blue lines). Bottom panel: residuals in number of sigmas with error bars of size one. The inset shows with detail the broadening at the base of the periodic signal. |
3.3 Spectral analysis
We extracted an EPIC-pn energy spectrum using the same source and background regions as for the timing analysis and filtering criteria described. For the spectral analysis we further cleaned the data by accepting only the good times when sky background was low. We rebinned the energy spectra by requiring at least 25 counts for each energy bin.
Single-component models do not give good fits. An absorbed blackbody model leaves residuals with a sinusoidal structure and differences between the data and the model of ≳ 2σ in 17% of the bins. This model gives a reduced χ2 = 2 for 150 degrees of freedom (dof). A single power law does not describe the spectrum either with  for 150 dof. The addition of a cutoff provides an acceptable fit (
 for 149 dof). The best-fit spectral parameters for the power-law plus cutoff model are: NH = (4.7 ± 0.3) × 1021 cm−2, Γ = −0.40 ± 0.09, and Ecut = 2.1 ± 0.1 keV. These values are significantly different from the typical values in accreting pulsars and are hard to interpret. The photon index and cutoff energy in accreting pulsars vary typically in the ranges 0.5–1.5 keV and 10–20 keV, respectively.
The combination of a blackbody and a power law provides an excellent fit with  for 148 dof. In this case, the following best-fit parameters are found: NH = (6.2 ± 0.5) × 1021 cm−2, kTbb = 1.16 ± 0.03 keV, and Γ =1.5 ± 0.1. The uncertainties correspond to 1σ errors. The normalization of the blackbody component agrees with an emitting region of Rbb = 200 ± 50 m in size. The column density was obtained assuming abundances given in Anders & Grevesse (1989) and cross-sections from Verner et al. (1996). Figure 5 shows the EPIC-pn spectrum and the two-component model described above. The total absorbed X-ray luminosity in the energy range 0.2–12 keV is 1.5 × 1034 erg s−1 (1.8 × 1034 erg s−1, unabsorbed), assuming a distance of 4.5 kpc (Reig et al. 2010). The contribution from each model component to the total luminosity is Lbb = 9.3 × 1033 erg s−1 and Lpl = 8.6 × 1033 erg s−1. The contribution of the blackbody component to the source luminosity amounts to ~52%. This value is somewhat larger but comparable to that measured in other BeXBs (La Palombara & Mereghetti 2006, 2007; La Palombara et al. 2009). We found no evidence for an iron emission line. The upper limit on the equivalent width of a narrow (σ = 0.1 keV) 6.4 keV emission line is 30 eV.
4 Discussion
We have carried out an X-ray timing and spectral analysis of IGR J06074+2205 at a time when no X-ray emission should be expected. The circumstellar (decretion) disk around the Be star’s equator had presumably vanished at the time of the XMM-Netwon observation. Not only did we detect the source at a relatively high level (1034 erg s−1), but we also report X-ray pulsations for the first time in this source.
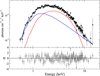 |
Fig. 5 EPIC-pn spectrum of IGR J06074+2205 (circles) and best-fit model (black line), which consists of a blackbody (red line) and a power law (blue line). Bottom panel: residuals in terms of sigmas with error bars of size one. |
4.1 Coupling between the periodic and aperiodic variability
The power spectrum of IGR J06074+2205 is characterized by the narrow peaks of the periodic modulation and its harmonics and by a noise component whose power increases toward lower frequencies. Red noise is a common characteristic in all kind of accreting binaries. It is attributed to instabilities in the accretion flow as it approaches the compact object. If these instabilities are produced after the flow is trapped by the magnetic field, they should be affected by the periodic modulation (Lazzati & Stella 1997; Burderi et al. 1997). The power spectrum of IGR J06074+2205 is very similar to that of SMC X–1 (Burderi et al. 1997), Vela X–1 and 4U 1145–62 (Lazzati & Stella 1997) and shows a strong coupling of the red noise with the periodic modulation. This coupling manifests observationally by the broadening of the wings of the narrow peaks due to the periodic modulation and becomes more apparent when the red-noise power increases short-ward of the pulsar frequency, as is the case in IGR J06074+2205.
4.2 Origin of the quiescent X-ray emission
In this section, we discuss the possible mechanisms that may account for the X-ray emission of accreting pulsars at low luminosities. Accretion can explain the X-ray luminosity observed in X-ray pulsars in a large range from 1034 to 1038 erg s−1. Two are the basic ingredients in the accretion mechanism: a source of matter and a strong gravitational potential. In accreting pulsars, the magnetic field also plays a fundamental role because together with the mass accretion rate it defines the size of the magnetosphere. In BeXBs, the source of matter is the circumstellar disk around the Be star, while the source of strong gravity is the neutron star.
Accretion may cease if the mass accretion rate Ṁ goes below a critical value. When the radius of the magnetosphere, rm grows beyond the co-rotation radius, rco (at which the angular velocity of Keplerian motion is equal to that of the neutron star), the centrifugal force prevents material from entering the magnetosphere. This is known as the propeller effect (Illarionov & Sunyaev 1975) or centrifugal inhibition of accretion (Stella et al. 1986). While rco does not depend on quantities that vary substantially with the mass accretion rate,  , the radius of the magnetosphere strongly depends on the mass accretion rate
  , where μ is the magnetic moment. If Ṁ is highly reduced, then the inequality may reverse and become rm > rco, in which case the propeller mechanism sets in. Thus the propeller effect is expected to occur at the end of an X-ray outburst or when there is no supply of matter.
The minimum X-ray luminosity below which the propeller effect sets in can be determined by equating the co-rotation radius to the radius of the magnetosphere (Stella et al. 1986; Campana et al. 2002)
 (1)
(1)
where M1.4 and R6 are the mass and radius of the neutron star in units of 1.4 M⊙ and 106 cm, respectively, Pspin is the spin period in seconds, B12 is the magnetic field in unitsof 1012 G, and k is the ratio of the magnetosphere to the Alfen radius (typically k = 0.5 for disk accretion). For typical values of the magnetic field (a few times 1012 G), Lmin is of the order of ~ 1036 erg s−1 in rapid rotating pulsars (Pspin ~ 1 s). For long pulsing systems (Pspin ~ 100 s), it is significantly lower, Lmin ~ 1032 − 1033 erg s−1.
When the propeller effect is at work, X-rays may be generated through magnetospheric accretion (Corbet 1996; Campana et al. 2001). In this scenario, the matter in the accretion flow is halted at the magnetospheric boundary and would not reach the neutron star surface. On first approximation, the accreted luminosity will be driven by the same mass transfer as in the accretor regime but with the magnetospheric radius replacing the neutron star radius Lm ≈ GMXṀ∕rm. The maximum luminosity in this regime will occur when the magnetospheric radius equals the corotation radius (Campana et al. 2002),
 (2)
(2)
Although X-ray pulsations may still be produced in this state, the pulse fraction should be lower than in the case of accretion onto the polar caps. The luminosity is expected to be very low Lmag ≲ 1031 erg s−1 for systems with Pspin > 100 s.
Because BeXBs contain massive companions, one may expect that matter could still proceed from the optical star into the compact object via the stellar wind. To estimate the X-ray luminosity that results from direct accretion from a stellar wind, we assume that all the gravitational energy is converted into X-rays, Lwind = GMX Ṁacc∕RX and that the fraction of the stellar wind captured by the neutron star is (Frank et al. 2002)
 (3)
(3)
where a is the orbital separation, Ṁ the mass-loss rate of the Be star, and vw the terminal velocity of the stellar wind. Using Kepler’s law to replace a we finally obtain (see also Waters et al. 1988)
 (4)
(4)
where M* is the mass of the optical star in solar masses and Porb is the orbital period of the binary in days. The mass-loss rate of the Be star is in units of 10−6 M⊙ yr−1 and the wind velocity is in units of 108 cm s−1. The classical supergiant X-ray binaries are believed to be powered by accretion via a strong stellar wind.
The alternative to direct accretion from a high- or low-velocity outflow is that accretion proceeds through magnetospheric leakage via an accretion disk (Tsygankov et al. 2017a,b, see also Syunyaev & Shakura 1977). If the mass accretion rate is low enough that the temperature outside the magnetosphere remains below 6500 K, i.e., the temperature at which hydrogen recombines (above 6500 K hydrogen is ionised), then a cold disk is formed. Accretion is expected to proceed at a low rate. The X-ray luminosity in this state is (Tsygankov et al. 2017a)
 (5)
(5)
where A is a parameter that depends on the location at which the viscous stress disappears as it interacts with the magnetosphere and varies in the range 0.06–1 (A ≈ 0.06 if the stress disappears at rm). According to this scenario, if Lmin > Ldisk, then the pulsar will transit to the propeller state. Otherwise, accretion at a low rate would proceed from the cold disk.
If accretion stops completely, then the only other mechanism that can also give rise to X-rays is the cooling of the neutron star. Duringthe accretion phase, the crust of a neutron star is heated by nuclear reactions. This heat is conducted inwards, heating the core, and outwards, where it is emitted as thermal emission from the surface. After the active accretion period, the crust of a neutron star cools by X-ray emission until it reaches thermal equilibrium with the core emission corresponding to the quiescent state (Brown et al. 1998; Rutledge et al. 2007; Wijnands & Degenaar 2016).
In summary, there are two basic mechanisms to explain the X-ray emission of accreting pulsars at very low luminosities, namely accretion and cooling of the neutron star surface. In either case, the physical conditions on which these mechanisms occur lead to different scenarios. Accretion may occur at the magnetosphere via a stellar wind or through an accretion disk. Likewise, the main contribution to the cooling process may come from the entire surface of the neutron star or from the polar caps. In principle, timing and spectral analysis may help distinguish between the various possibilities. In general terms, if accretion takes place, we expect a power-law dominated spectrum (due to Comptonization) and significant variability (rms > 10%), while a thermal spectrum and white-noise-dominated power spectrum is expected in the case of cooling of the polar caps. A combination of the two cannot be ruled out.
4.3 IGR J06074+2205
In this section we discuss which of the possible scenarios best describes the X-ray properties of IGR J06074+2205.
First, we examine whether the system enters the propeller state, as expected by the disappearance of the source that supplies matter to the neutron star. Unfortunately, there is no direct estimate of the magnetic field of the neutron star in IGR J06074+2205, hence Lmin (Eq. (1)) cannot be calculated. With a spin period of 373.2 s, we would expect Lmin to be relatively low. Assuming B ~ 5 × 10¹², the luminosity at which the source would enter the propeller state is Lmin ~ 1033 erg s−1. This is well below the observed luminosity. Reversing the argument, if the observed luminosity corresponded to the propeller state, then a magnetic field of B ~ 2 × 10¹³ G would be needed, which is three times larger than the largest measured magnetic field in an accreting pulsar implied by the detection of cyclotron lines (Yamamoto et al. 2014; Walter et al. 2015). If centrifugal inhibition of accretion was at work in IGR J06074+2205, then the X-ray emission could in principle result from magnetospheric accretion. However, there are several reasons why this mechanism can be ruled out. When the source enters the centrifugally inhibited state, a sharp drop of one or two orders of magnitude in luminosity (from Lmin to Lmag) in the accreting luminosity should be observed. This drop would occur on time scales of a few days (Corbet 1996; Campana et al. 2002; Tsygankov et al. 2016; Reig & Milonaki 2016). The X-ray luminosity expected from magnetospheric accretion is far too low even in the case of a very strong magnetic field, Lmag ~ 1030 erg s−1 (Eq. (2)). This low luminosity is a consequence of the strong dependence of Lmag on Pspin ( ). Second, thebest-fit spectral parameters imply a small emitting radius, Rbb ~ 0.2 km, which is too small to come from an extended region at Rm~ 109 cm. Finally, the coupling of the periodic signal and the noise indicates that particles in the accretion flow have moved down along the magnetic field lines close to the surface of the neutron star.
The cooling of the neutron star surface also encounters a number of problems as the main mechanism producing the X-ray emission in IGR J06074+2205. The blackbody temperature and small emitting area imply that the cooling cannot occur over the entire surface of the pulsar. In fact, the large pulse fraction and broad pulse profiles indicate that the emission arises from a rotating region which is hotter (and more luminous) than the rest of the surface of the neutron star. Although nonuniform cooling can be attributed to the strong magnetic field (Geppert et al. 2006; Wijnands & Degenaar 2016), the X-ray spectrum of IGR J06074+2205 deviates from pure thermal emission. There is excess emission above ~7 keV in the form of a power law, indicating the presence of nonthermal processes. Another result that argues against a purely thermal process in IGR J06074+2205 is the degree of variability and shape of the power spectral continuum. The XMM-Newton power spectrum shows strong low-frequency noise (red noise). White noise, that is, no dependence of power on frequency, would be expected in case of thermal cooling. Red noise is believed to be produced by aperiodic variability associated with instabilities in the accretion flow. Finally, the observed X-ray luminosity is higher than predicted from crustal heating. The X-ray luminosity expected from crustal heating depends on the time-averaged accretion rate as Lq ~ 6 × 1032(Ṁ∕1 × 10⁻¹¹) M⊙ yr−1, where Ṁ is the average accretion rate including outbursts (Brown et al. 1998; Rutledge et al. 2007; Wijnands et al. 2013). Typical values of Lq in BeXBs are well below 1034 erg s−1 (Tsygankov et al. 2017b).
Although crustal heating is not the dominating mechanism that accounts for the observed X-ray emission in IGR J06074+2205, a strong thermal component is present. The high temperature, small area, and large pulse fraction strongly suggest that the origin of this component is the polar caps. This thermal component has been observed in many, probably all, accreting X-ray pulsars (Hickox et al. 2004). In fact the values of kTbb = 1.16 ± 0.03 keV and Rbb = 200 ± 50 m agree well with those of 1 A0536+262 (Mukherjee & Paul 2005), RX J0146.9+6121 (La Palombara & Mereghetti 2006), X-Per (La Palombara & Mereghetti 2007), and RX J1037.5–5647 (La Palombara et al. 2009). All these systems were observed to have a similar luminosity to that of IGR J06074+2205 (LX ≲ 1035 erg s−1) and displayed a similar spectrum, namely an absorbed power law plus blackbody emission. An important difference of IGR J06074+2205 with respect to all these systems (except for RX J1037.5–5647 for which no information could be found) is that at the time of the X-ray observation, they all had Hα in emission, indicating the presence of the equatorial disk (Reig et al. 2016).
In summary, (i) the amplitude of the X-ray variability (rms = 40%, red noise), (ii) the detection of pulsations with a high pulse fraction (PF ≳ 50%), (iii) the power-law component (Γ = 1.5), (iv) the coupling between periodic and aperiodic variability, and v) the small emitting area strongly suggest that X-rays from IGR J06074+2205 detected during the XMM-Newton observation result from accretion. The question that remains to be answered is how accretion could proceed when the main source of matter was exhausted.
Let us now examine the possibility of accretion from a stellar wind. Be stars, by definition, are dwarf, subgiant or giant objects (luminosity class III−V). Consequently, the stellar wind is weak. Assuming typical parameters RX = 106 cm, MX = 1.4 M⊙, M* = 15 M⊙ (as expected for a B0.5V star Reig et al. 2010),  M⊙ yr−1 (Prinja 1989; Vink et al. 2000), vwind ~ vesc ≈ 8.5 × 108 cm s−1, and Porb = 100 days, the X-ray luminosity from the stellar wind is well below 1033 erg s−1. Lwind approaches the observed X-ray luminosity only if Porb ≲ 10 days or vwind is abnormally low (400–500 km s−1). BeXBs have orbital periods well above 20 days. From the Porb–Pspin relationship(Corbet 1986; Reig 2011), a system with Pspin = 373 s should have Porb ≳ 100 days. An exception is SAX J2103.5+4545, which is the BeXB with the shortest orbital period of 12.7 days but has a pulse periodof 358 s (Baykal et al. 2002). Abnormally slow winds have been reported in one BeXB, 4U 2206+54 (Ribó et al. 2006). However, 4U 2206+54 is a rather peculiar object (Blay et al. 2006). Reig & Zezas (2014) argued that a weak and small disk might be present in the BeXB IGR J21343+4738 even though an absorption Hα profile was observed. A low-velocity outflow from this highly debilitated disk with vwind ~ 300–500 km s−1 could explain the X-ray luminosity of ~ 1035 erg s−1, measured in that system. Accretion from an invisible (in the optical and IR bands) disk was also proposed by Ikhsanov (2001) to explain the quiescent emission of 1A 0535+262. We conclude that direct accretion from stellar wind cannot explain the origin of the X-ray emission in IGR J06074+2205, although a slow outflow from a weak optically undetectable equatorial disk cannot be ruled out. The fact that the Hα line showed clear evidence for emission less than two months after the XMM-Newton observation and that the EW(Hα) was slightly smaller than that expected from a fully photospheric line possibly indicate the presence of a very weak residual disk.
The alternative to direct accretion is the formation of an accretion disk. The centrifugal barrier caused by the rotating magnetosphere is strongly suppressed if an accretion disk is present. Such a disk will form if the source luminosity is below the limiting luminosity given in Eq. (5). If this luminosity is reached before the propeller minimum luminosity the source will transit to stable accretion from an entirely recombined cold disk (Tsygankov et al. 2017a). For a typical X-ray pulsar with a magnetic field around 2 × 10¹² G, Ldisk ~ 2 × 1034 erg s−1 erg s−1, while Lmin would be two orders of magnitude lower. Hence Lmin < Ldisk, and the condition under which the source may accrete matter from the cold disk is met.
The long spin period of IGR J06074+2205 and the detection of X-ray pulsations put this source along with 1A 0535+26, 4U 1145–619, and 1A 1118–615, in a category of systems with accretion powered quiescent emission.
5 Conclusion
We perform an X-ray timing and spectral analysis of the BeXB candidate IGR J06074+2205. We discovered pulsations with a pulse period of 373.2 s. Hence, our observations convert IGR J06074+2205 from a candidate BeXB to a confirmed accreting pulsar. We also found strong coupling between the periodic and aperiodic variability, which manifests itself as a broadening of the base of the pulse peak in the power spectrum. The X-ray spectrum is well described by a thermal (blackbody) and a nonthermal (power law) components, affected by interstellar absorption. We did not find evidence for iron emission at 6.4 keV. The presence of the nonthermal component (interpreted as coming from bulk Comptonization), the strong red noise in the power spectrum, the pulsations, and the small emitting area of the thermal component (polars caps) are all considered as signatures of accretion and rule out cooling of the accretion-heated neutron star crust as the sole mechanism that explains our XMM-Newton observation. Although accretion powers the quiescent emission in IGR J06074+2205, we cannot tell whether the source of accreted matter is a slow wind coming out from a weak decretion disk or froma recombined cold accretion disk. We should emphasize that the order of magnitude calculations presented inthis work strongly depend on the magnetic fields strength. In the absence of a direct measurement, for example, through the detection of a cyclotron resonant scattering feature, these numbers should be taken with caution.
Acknowledgements
We thank N. Schartel for his fast response to our request to observe the source and for approving a TOO observation under Discretionary time. Skinakas Observatory is run by the University of Crete and the Foundation for Research and Technology-Hellas. A.Z. acknowledges funding from the European Union’s Seventh Framework Programme (FP/2007-2013)/ERC Grant Agreement No. 617001.
References
- Anders, E., & Grevesse, N. 1989, Geochim. Cosmochim. Acta, 53, 197 [Google Scholar]
- Baykal, A., Stark, M. J., & Swank, J. H. 2002, ApJ, 569, 903 [NASA ADS] [CrossRef] [Google Scholar]
- Blay, P., Negueruela, I., Reig, P., et al. 2006, A&A, 446, 1095 [NASA ADS] [CrossRef] [EDP Sciences] [Google Scholar]
- Brown, E. F., Bildsten, L., & Rutledge, R. E. 1998, ApJ, 504, L95 [Google Scholar]
- Burderi, L., Robba, N. R., La Barbera, N., & Guainazzi, M. 1997, ApJ, 481, 943 [NASA ADS] [CrossRef] [Google Scholar]
- Campana, S., Gastaldello, F., Stella, L., et al. 2001, ApJ, 561, 924 [NASA ADS] [CrossRef] [Google Scholar]
- Campana, S., Stella, L., Israel, G. L., et al. 2002, ApJ, 580, 389 [NASA ADS] [CrossRef] [Google Scholar]
- Chenevez, J., Budtz-Jorgensen, C., Lund, N., et al. 2004, ATel, 223 [Google Scholar]
- Corbet, R. H. D. 1986, MNRAS, 220, 1047 [NASA ADS] [CrossRef] [Google Scholar]
- Corbet, R. H. D. 1996, ApJ, 457, L31 [NASA ADS] [CrossRef] [Google Scholar]
- den Herder, J. W., Brinkman, A. C., Kahn, S. M., et al. 2001, A&A, 365, L7 [NASA ADS] [CrossRef] [EDP Sciences] [Google Scholar]
- Frank, J., King, A., & Raine, D. J. 2002, Accretion Power in Astrophysics: 3rd edn. (Cambridge: Cambridge University Press) [Google Scholar]
- Geppert, U., Küker, M., & Page, D. 2006, A&A, 457, 937 [NASA ADS] [CrossRef] [EDP Sciences] [Google Scholar]
- Halpern, J. P., & Tyagi, S. 2005, ATel, 682 [Google Scholar]
- Hickox, R. C., Narayan, R., & Kallman, T. R. 2004, ApJ, 614, 881 [NASA ADS] [CrossRef] [Google Scholar]
- Ikhsanov, N. R. 2001, A&A, 367, 549 [NASA ADS] [CrossRef] [EDP Sciences] [Google Scholar]
- Illarionov, A. F., & Sunyaev, R. A. 1975, A&A, 39, 185 [NASA ADS] [Google Scholar]
- Jansen, F., Lumb, D., Altieri, B., et al. 2001, A&A, 365, L1 [NASA ADS] [CrossRef] [EDP Sciences] [Google Scholar]
- Jaschek, C., & Jaschek, M. 1987, The Classification of Stars (Cambridge: Cambridge University Press) [Google Scholar]
- La Palombara, N., & Mereghetti, S. 2006, A&A, 455, 283 [NASA ADS] [CrossRef] [EDP Sciences] [Google Scholar]
- La Palombara, N., & Mereghetti, S. 2007, A&A, 474, 137 [NASA ADS] [CrossRef] [EDP Sciences] [Google Scholar]
- La Palombara, N., Sidoli, L., Esposito, P., Tiengo, A., & Mereghetti, S. 2009, A&A, 505, 947 [NASA ADS] [CrossRef] [EDP Sciences] [Google Scholar]
- Larsson, S. 1996, A&AS, 117, 197 [NASA ADS] [CrossRef] [EDP Sciences] [Google Scholar]
- Lazzati, D., & Stella, L. 1997, ApJ, 476, 267 [NASA ADS] [CrossRef] [Google Scholar]
- Leahy, D. A. 1987, A&A, 180, 275 [NASA ADS] [Google Scholar]
- Leahy, D. A., Darbro, W., Elsner, R. F., et al. 1983, ApJ, 266, 160 [NASA ADS] [CrossRef] [Google Scholar]
- Mason, K. O., Breeveld, A., Much, R., et al. 2001, A&A, 365, L36 [NASA ADS] [CrossRef] [EDP Sciences] [Google Scholar]
- Mukherjee, U., & Paul, B. 2005, A&A, 431, 667 [NASA ADS] [CrossRef] [EDP Sciences] [Google Scholar]
- Negueruela, I., Reig, P., Finger, M. H., & Roche, P. 2000, A&A, 356, 1003 [NASA ADS] [Google Scholar]
- Paul, B., & Naik, S. 2011, Bull. Astron. Soc. India, 39, 429 [NASA ADS] [Google Scholar]
- Prinja, R. K. 1989, MNRAS, 241, 721 [NASA ADS] [CrossRef] [Google Scholar]
- Reig, P. 2011, Ap&SS, 332, 1 [NASA ADS] [CrossRef] [Google Scholar]
- Reig, P., & Milonaki, F. 2016, A&A, 594, A45 [NASA ADS] [CrossRef] [EDP Sciences] [Google Scholar]
- Reig, P., & Zezas, A. 2014, MNRAS, 442, 472 [Google Scholar]
- Reig, P., Zezas, A., & Gkouvelis, L. 2010, A&A, 522, A107 [NASA ADS] [CrossRef] [EDP Sciences] [Google Scholar]
- Reig, P., Doroshenko, V., & Zezas, A. 2014, MNRAS, 445, 1314 [NASA ADS] [CrossRef] [Google Scholar]
- Reig, P., Nersesian, A., Zezas, A., Gkouvelis, L., & Coe, M. J. 2016, A&A, 590, A122 [NASA ADS] [CrossRef] [EDP Sciences] [Google Scholar]
- Ribó, M., Negueruela, I., Blay, P., Torrejón, J. M., & Reig, P. 2006, A&A, 449, 687 [NASA ADS] [CrossRef] [EDP Sciences] [Google Scholar]
- Rutledge, R. E., Bildsten, L., Brown, E. F., et al. 2007, ApJ, 658, 514 [NASA ADS] [CrossRef] [Google Scholar]
- Stella, L., White, N. E., & Rosner, R. 1986, ApJ, 308, 669 [NASA ADS] [CrossRef] [Google Scholar]
- Strüder, L., Briel, U., Dennerl, K., et al. 2001, A&A, 365, L18 [NASA ADS] [CrossRef] [EDP Sciences] [Google Scholar]
- Syunyaev, R. A., & Shakura, N. I. 1977, Sov. Astron. Lett., 3, 138 [NASA ADS] [Google Scholar]
- Tomsick, J. A., Chaty, S., Rodriguez, J., Walter, R., & Kaaret, P. 2006, ATel, 959 [Google Scholar]
- Tsygankov, S. S., Lutovinov, A. A., Doroshenko, V., Mushtukov, A. A., & Poutanen, J. 2016, A&A, 593, A16 [NASA ADS] [CrossRef] [EDP Sciences] [Google Scholar]
- Tsygankov, S. S., Mushtukov, A. A., Suleimanov, V. F., et al. 2017a, A&A, 608, A17 [NASA ADS] [CrossRef] [EDP Sciences] [Google Scholar]
- Tsygankov, S. S., Wijnands, R., Lutovinov, A. A., Degenaar, N., & Poutanen, J. 2017b, MNRAS, 470, 126 [NASA ADS] [CrossRef] [Google Scholar]
- Turner, M. J. L., Abbey, A., Arnaud, M., et al. 2001, A&A, 365, L27 [NASA ADS] [CrossRef] [EDP Sciences] [Google Scholar]
- van der Klis, M. 1989, in NATO Advanced Science Institutes (ASI) Series C, (New York: Kluwer Academic/Plenum Publisher), eds. H. Ögelman, & E. P. J. van den Heuvel, 262 [Google Scholar]
- Verner, D. A., Ferland, G. J., Korista, K. T., & Yakovlev, D. G. 1996, ApJ, 465, 487 [NASA ADS] [CrossRef] [Google Scholar]
- Vink, J. S., de Koter, A., & Lamers, H. J. G. L. M. 2000, A&A, 362, 295 [NASA ADS] [Google Scholar]
- Walter, R., Lutovinov, A. A., Bozzo, E., & Tsygankov, S. S. 2015, A&ARv, 23, 2 [NASA ADS] [CrossRef] [Google Scholar]
- Waters, L. B. F. M., van den Heuvel, E. P. J., Taylor, A. R., Habets, G. M. H. J., & Persi, P. 1988, A&A, 198, 200 [NASA ADS] [Google Scholar]
- Wijnands, R., & Degenaar, N. 2016, MNRAS, 463, L46 [NASA ADS] [CrossRef] [Google Scholar]
- Wijnands, R., Degenaar, N., & Page, D. 2013, MNRAS, 432, 2366 [NASA ADS] [CrossRef] [Google Scholar]
- Yamamoto, T., Mihara, T., Sugizaki, M., et al. 2014, PASJ, 66, 59 [NASA ADS] [CrossRef] [Google Scholar]
All Figures
|
Fig. 1 Hα line profile before and after the X-ray observations on 29 September 2017. |
| In the text | |
|
Fig. 2 Upper panel: EPIC-pn power spectrum and ~5σ significance level. Lower panel: χ2 maximization after folding the data over a range of periods (epoch folding). |
| In the text | |
|
Fig. 3 Normalized pulse profiles at different energies. |
| In the text | |
|
Fig. 4 Powerspectrum of IGR J06074+2205 (circles) and model components, which consist of a broken power law (red dashed line)and multi Lorentzian profiles (blue lines). Bottom panel: residuals in number of sigmas with error bars of size one. The inset shows with detail the broadening at the base of the periodic signal. |
| In the text | |
|
Fig. 5 EPIC-pn spectrum of IGR J06074+2205 (circles) and best-fit model (black line), which consists of a blackbody (red line) and a power law (blue line). Bottom panel: residuals in terms of sigmas with error bars of size one. |
| In the text | |
Current usage metrics show cumulative count of Article Views (full-text article views including HTML views, PDF and ePub downloads, according to the available data) and Abstracts Views on Vision4Press platform.
Data correspond to usage on the plateform after 2015. The current usage metrics is available 48-96 hours after online publication and is updated daily on week days.
Initial download of the metrics may take a while.