Free Access
Fig. 5
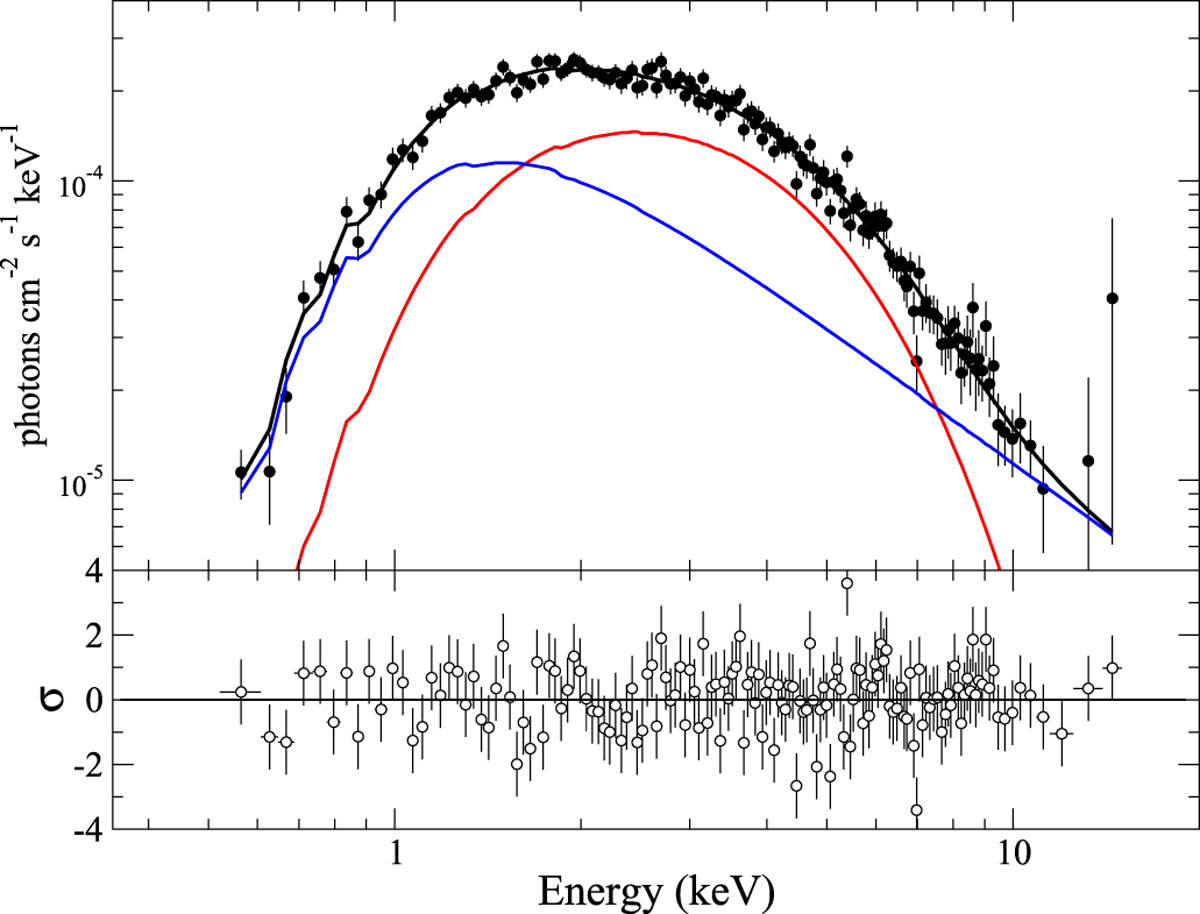
EPIC-pn spectrum of IGR J06074+2205 (circles) and best-fit model (black line), which consists of a blackbody (red line) and a power law (blue line). Bottom panel: residuals in terms of sigmas with error bars of size one.
Current usage metrics show cumulative count of Article Views (full-text article views including HTML views, PDF and ePub downloads, according to the available data) and Abstracts Views on Vision4Press platform.
Data correspond to usage on the plateform after 2015. The current usage metrics is available 48-96 hours after online publication and is updated daily on week days.
Initial download of the metrics may take a while.