Fig. D.1
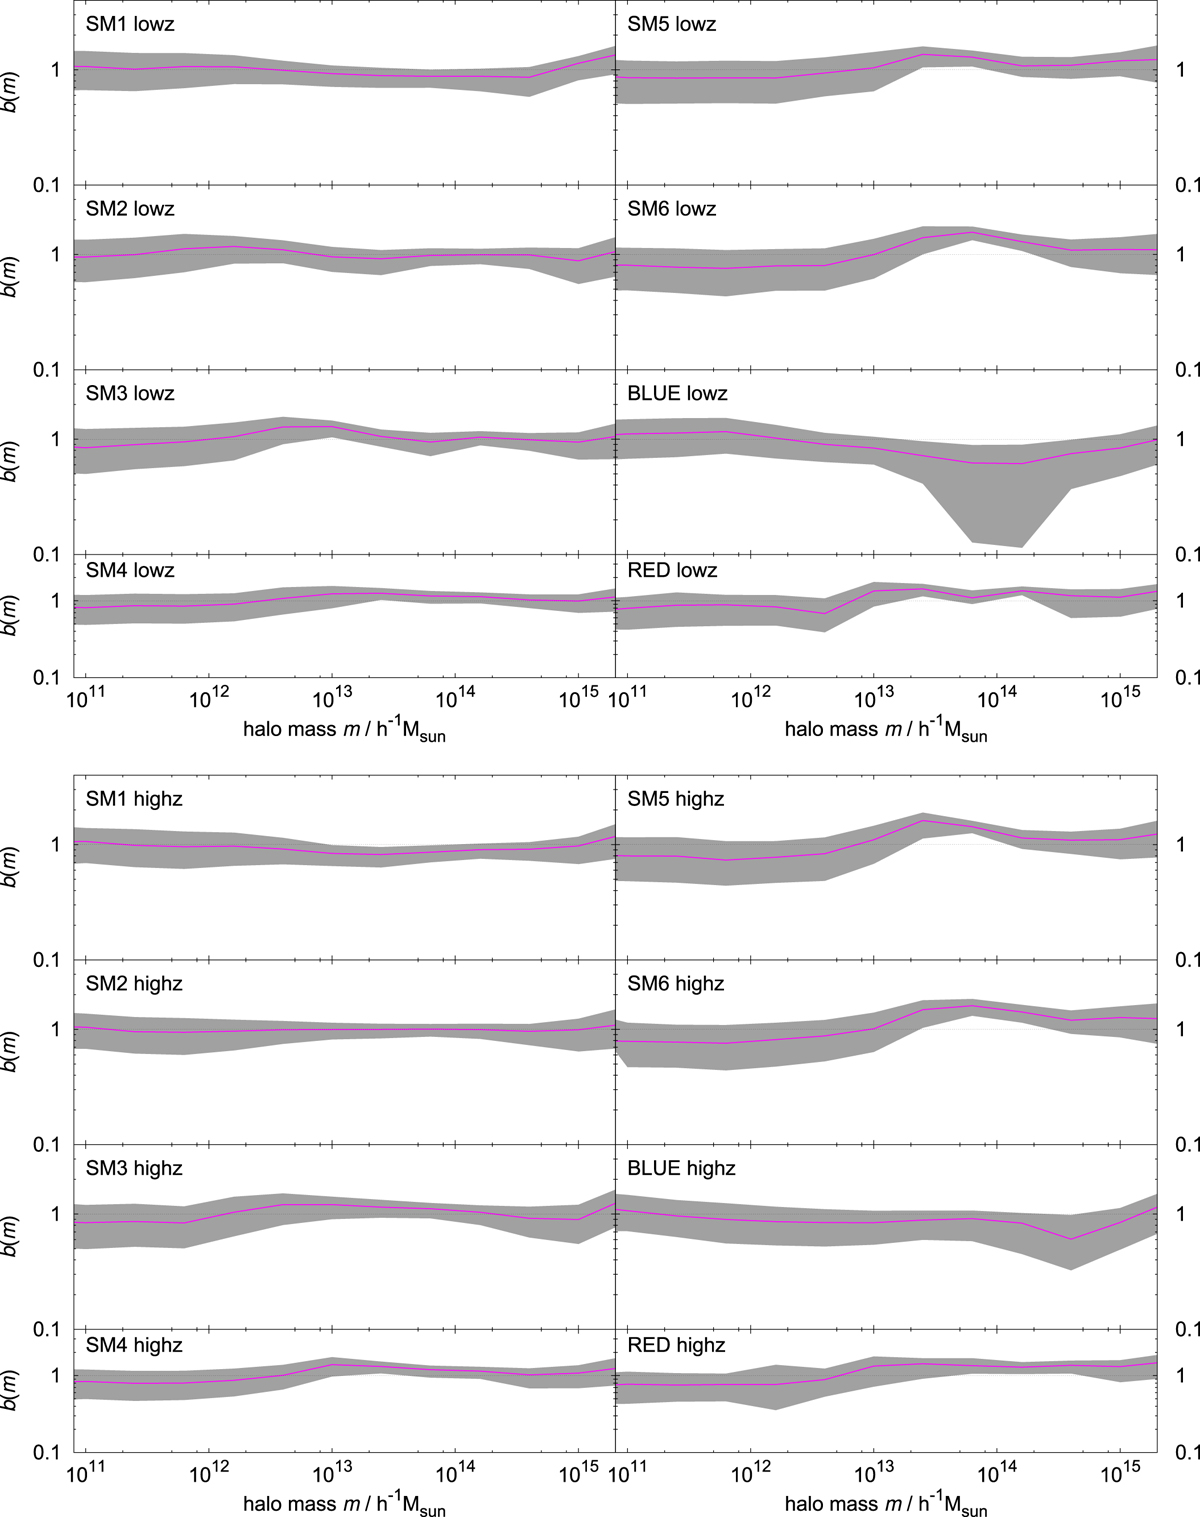
Mean biasing function b(m) for the mock galaxy samples SM1 to SM6 and the colour-selected samples BLUE and RED in the low-z (top) and high-z (bottom) redshift bin. The shaded regions indicate the 68% PI about the median for our fiducial mock survey.
Current usage metrics show cumulative count of Article Views (full-text article views including HTML views, PDF and ePub downloads, according to the available data) and Abstracts Views on Vision4Press platform.
Data correspond to usage on the plateform after 2015. The current usage metrics is available 48-96 hours after online publication and is updated daily on week days.
Initial download of the metrics may take a while.