Fig. 4
Timescales of variability of ![]() and
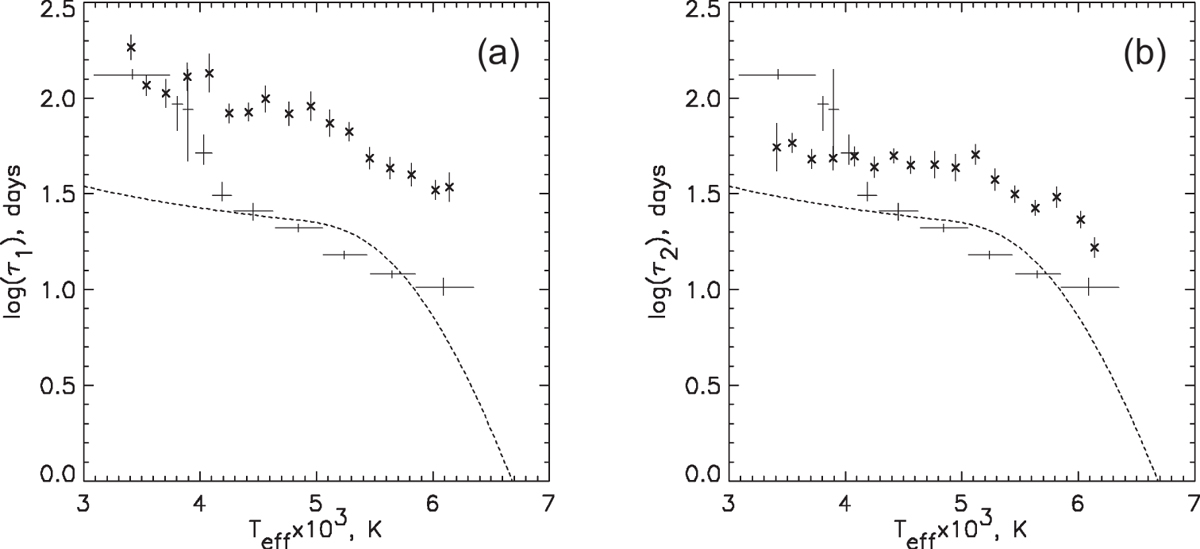
and ![]() , averaged in temperature bins (a): log(τ1) and (b): log(τ2) indicated by X symbols with error bars for the stars with 16 < P < 30 days vs. effective temperature Teff. For comparison, the estimates of the τMLT
turnover time by Noyes et al. (1984), are depicted by a dashed line and Wright et al. (2011) as error bar crosses.
, averaged in temperature bins (a): log(τ1) and (b): log(τ2) indicated by X symbols with error bars for the stars with 16 < P < 30 days vs. effective temperature Teff. For comparison, the estimates of the τMLT
turnover time by Noyes et al. (1984), are depicted by a dashed line and Wright et al. (2011) as error bar crosses.
Current usage metrics show cumulative count of Article Views (full-text article views including HTML views, PDF and ePub downloads, according to the available data) and Abstracts Views on Vision4Press platform.
Data correspond to usage on the plateform after 2015. The current usage metrics is available 48-96 hours after online publication and is updated daily on week days.
Initial download of the metrics may take a while.