Fig. 3
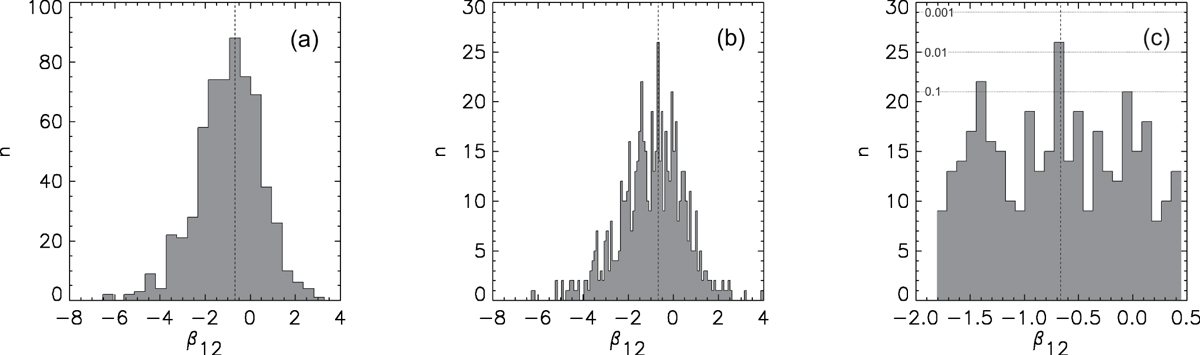
Histograms of the the gradient-like function β12 for 637 stars with 16 < P < 30 days obtained with bin widths 0.468 and 0.090 in (panel a) and (panel b), respectively. Panel c: shows the histogram features at the distribution maxima in (panel b) with the labeled probability of exceeding the specified levels (pointed lines), according to the binomial distribution (Eq. (2)). The vertical dashed line indicates the prediction of Kolmogorov’s theory of turbulence β12 = −2∕3. The value n is the number of β12 estimates in one bin of the histogram.
Current usage metrics show cumulative count of Article Views (full-text article views including HTML views, PDF and ePub downloads, according to the available data) and Abstracts Views on Vision4Press platform.
Data correspond to usage on the plateform after 2015. The current usage metrics is available 48-96 hours after online publication and is updated daily on week days.
Initial download of the metrics may take a while.