Fig. 2
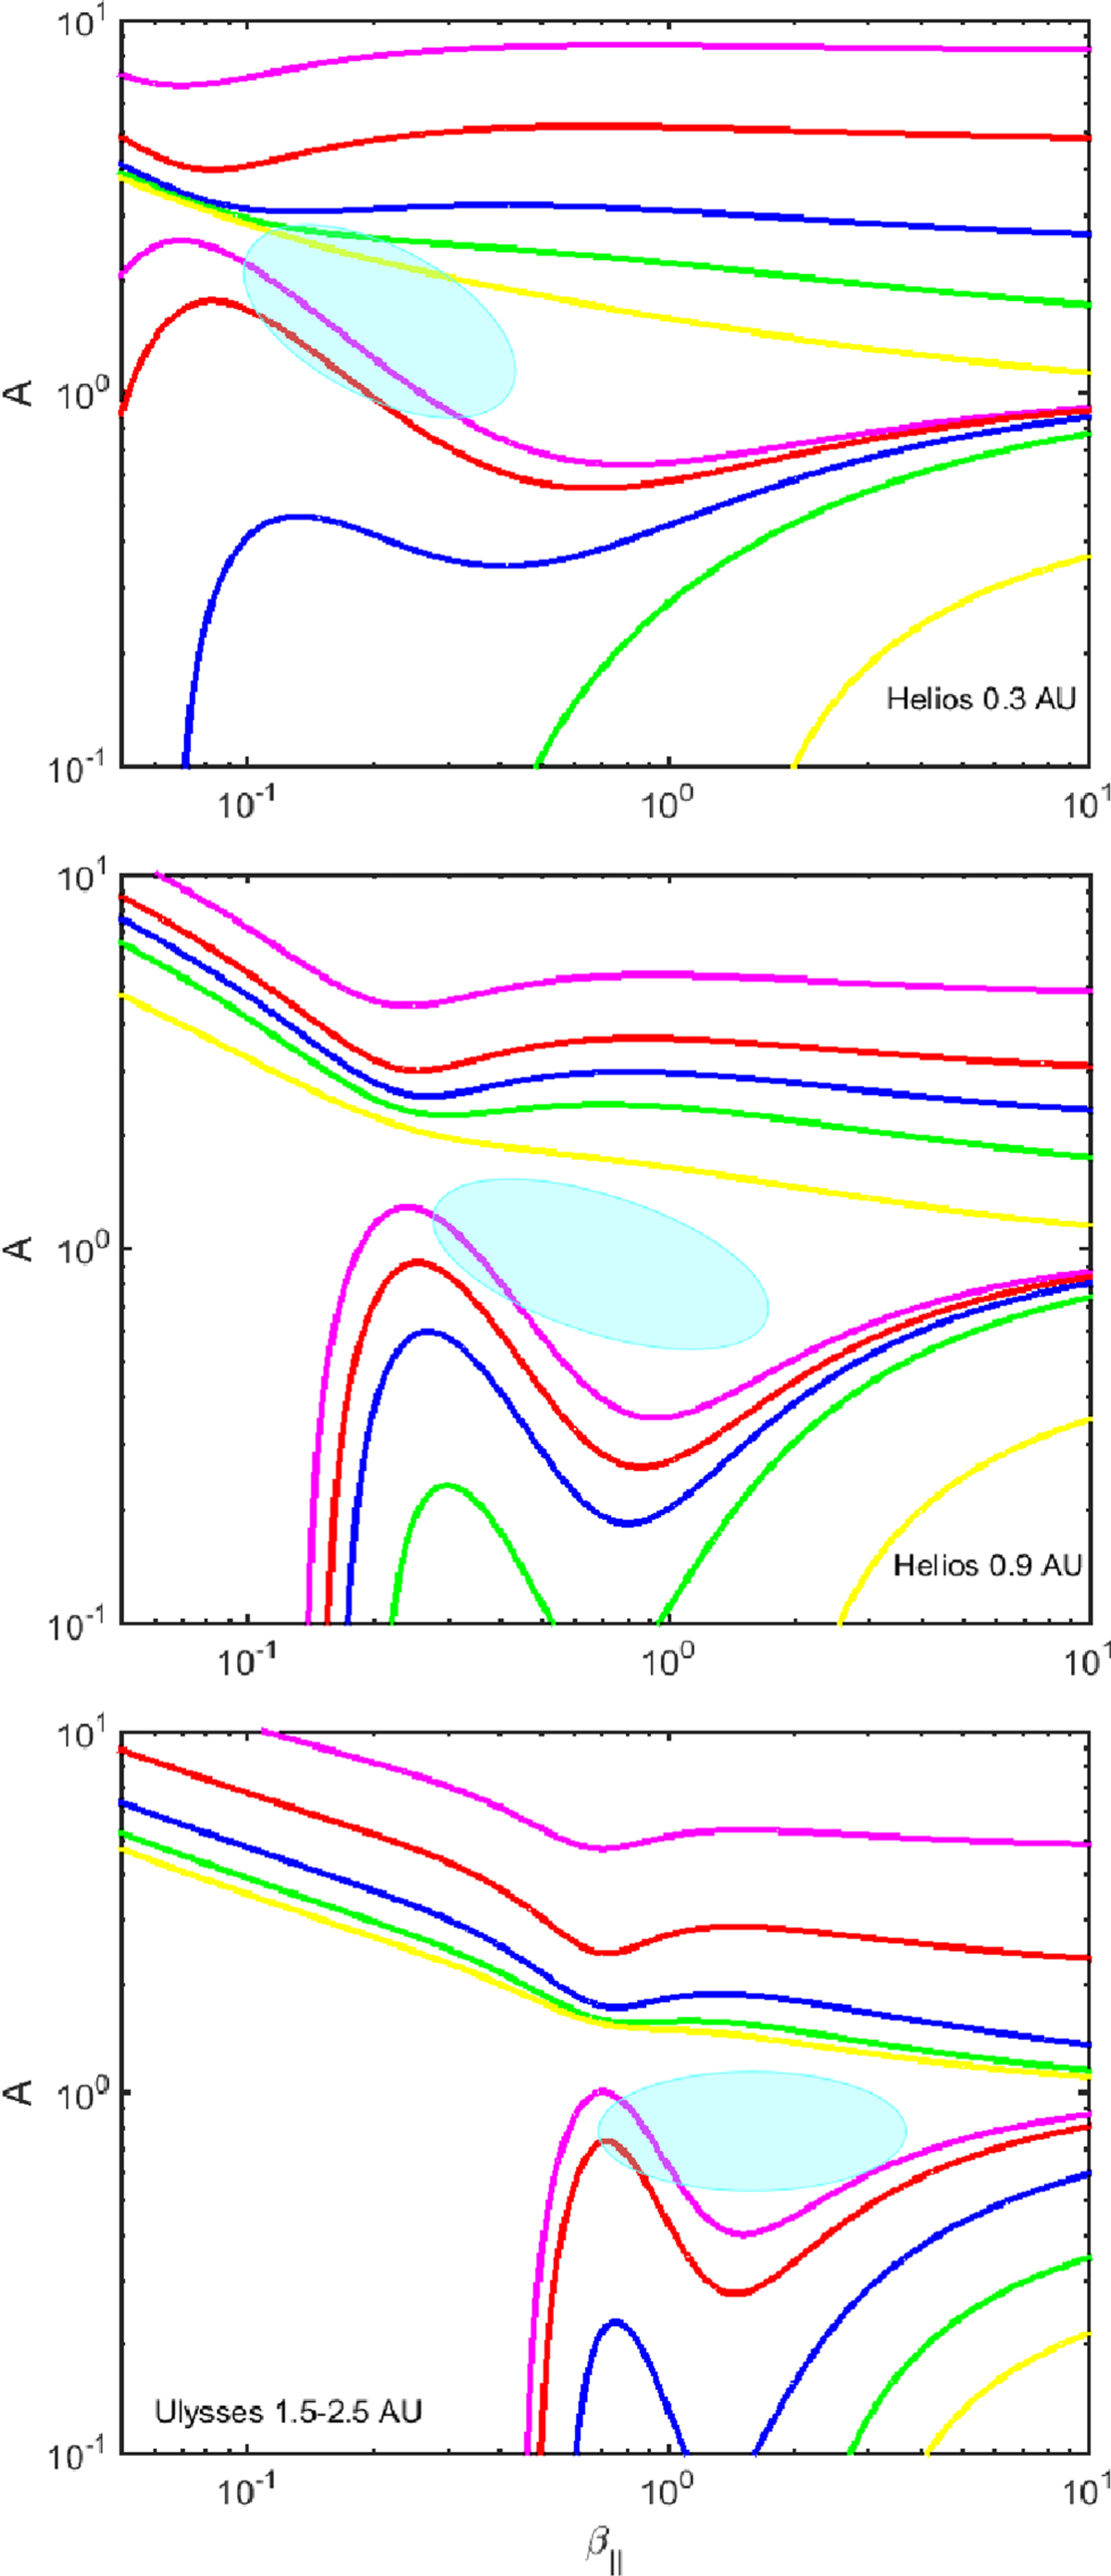
Comparison between the analytical instability conditions (Eqs. (4) and (5)) and fast solar wind data (V SW > 600 km s−1; Matteini et al. 2007) from the Helios at 0.3 AU (top panel) and 0.9 AU (middle panel), and from Ulysses at 1.5–2.5 AU (bottom panel). Top panel: magenta: ζ = π∕13, red ζ =π∕10, blue: ζ = π∕7.5, green: ζ = π∕6, yellow: ζ = π∕4. Middle panel: magenta: ζ = π∕10, red ζ =π∕8, blue: ζ = π∕7, green: ζ = π∕6, yellow: ζ = π∕4. Bottom panel: magenta: ζ = π∕10, red ζ =π∕7, blue: ζ = π∕5, green: ζ = π∕4, yellow: ζ = π∕3.5.
Current usage metrics show cumulative count of Article Views (full-text article views including HTML views, PDF and ePub downloads, according to the available data) and Abstracts Views on Vision4Press platform.
Data correspond to usage on the plateform after 2015. The current usage metrics is available 48-96 hours after online publication and is updated daily on week days.
Initial download of the metrics may take a while.