Fig. 2
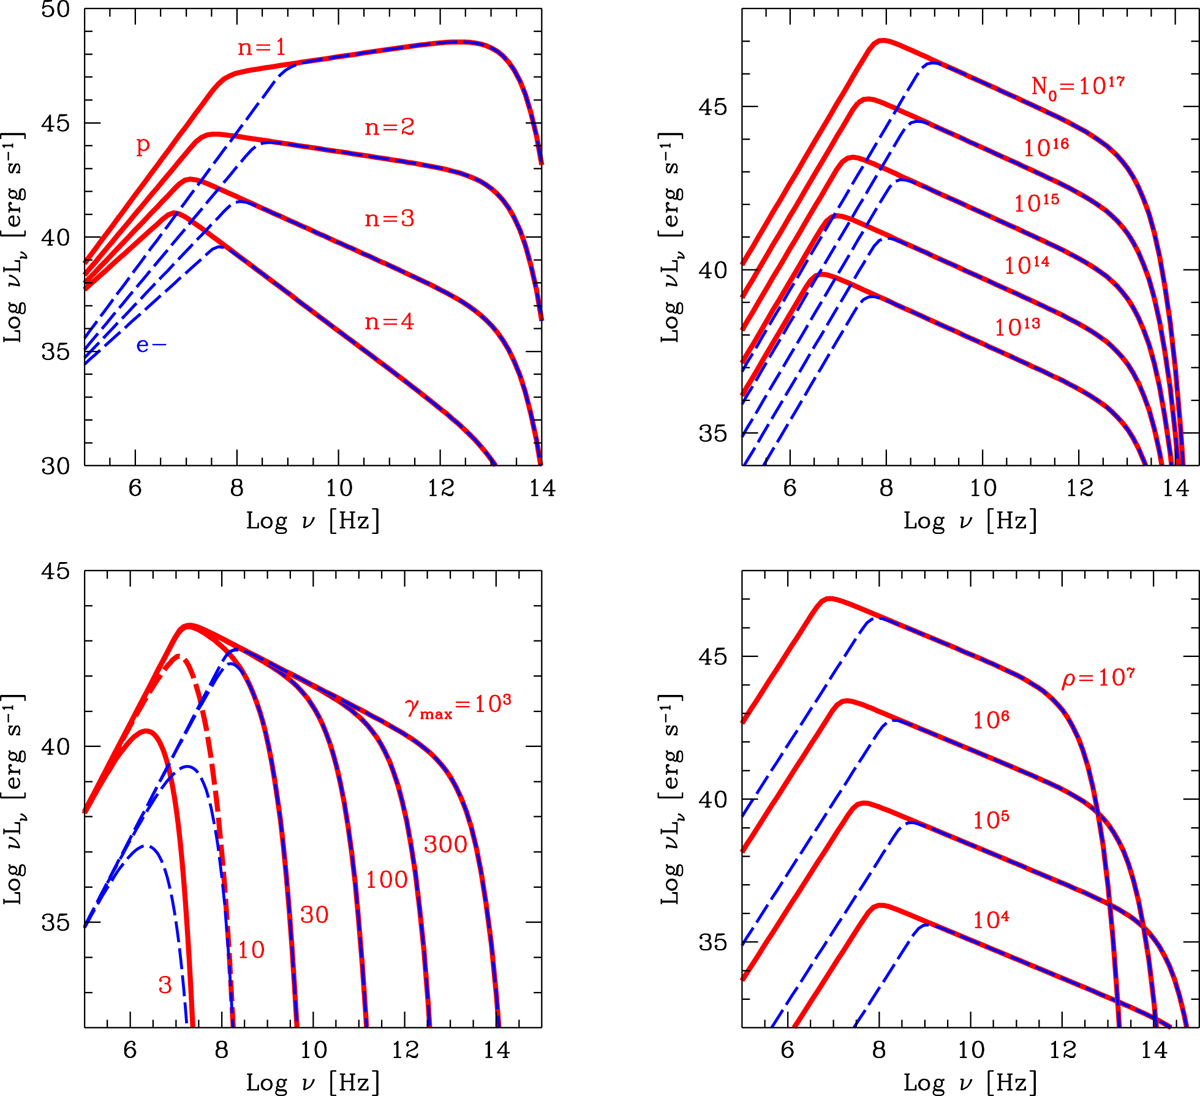
How the SED changes when changing the input parameters. The reference values of the parameters are a = 1, ρ = 106 cm, N0 = 1015 cm−3, n = 2.5, γmax = 103. The solid lines indicate SED produced by protons; the dashed line represents SED produced by leptons. Top left panel: the changing n is shown; contrary to the incoherent case, the self-absorbed spectrum also changes slope when changing n. Top right panel: the changing the density N0 of the particles distribution is shown. Bottom left panel: the changing the maximum electron energy γmax is indicated. Bottom right panel: the changing ρ is represented.
Current usage metrics show cumulative count of Article Views (full-text article views including HTML views, PDF and ePub downloads, according to the available data) and Abstracts Views on Vision4Press platform.
Data correspond to usage on the plateform after 2015. The current usage metrics is available 48-96 hours after online publication and is updated daily on week days.
Initial download of the metrics may take a while.