Fig. 8
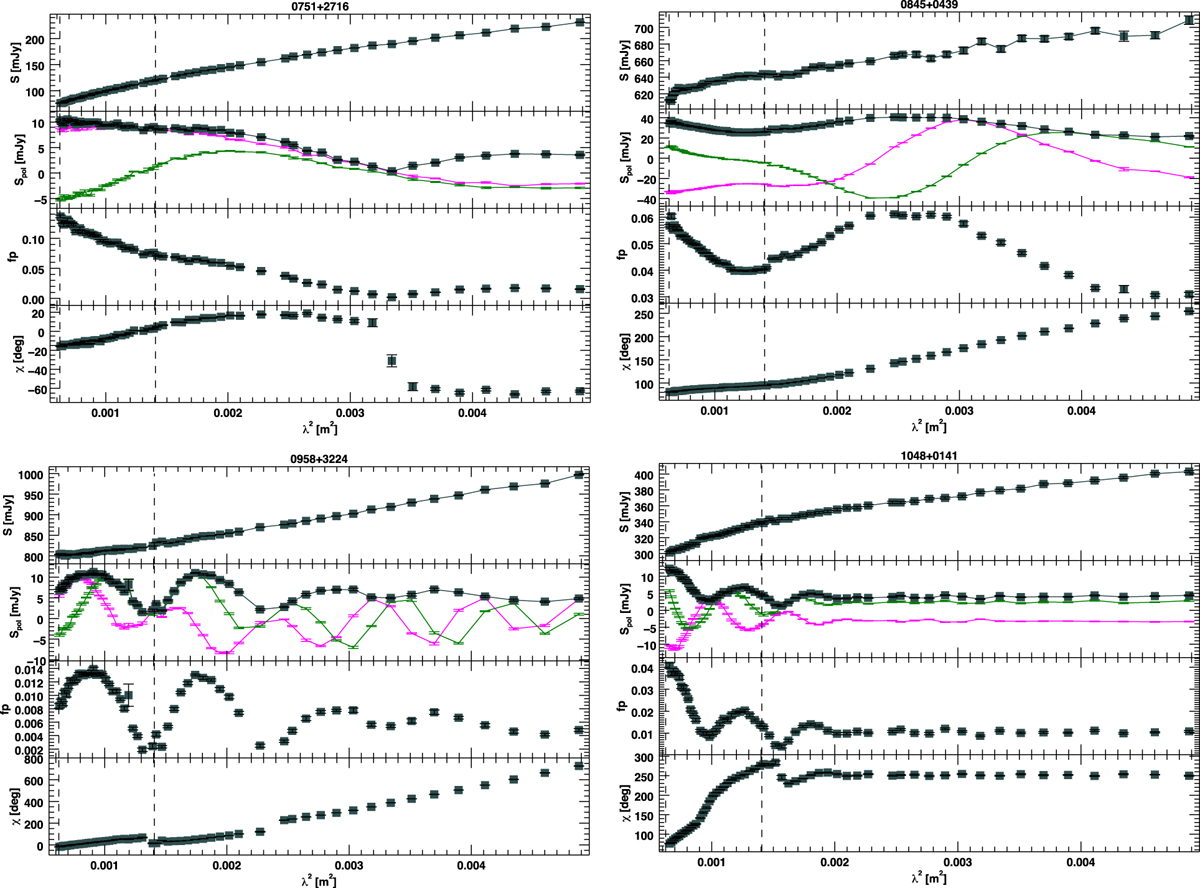
Polarization information of the sources at C and X bands. For each plot, first upper panel: the total intensity S expressed in [mJy] (the black line simply connects the points), second panel: the polarized flux density Spol expressed in [mJy], the Stokes parameters Q (magenta dots) and U (green dots) expressed in [mJy] (the black, the magenta, and the green lines simply connect the points); the third middle panel reports the fractional polarization; the last bottom panel shows the polarization angle χ expressed in [deg]. All this information is represented in the λ2 domain. Thevertical dashed lines indicate the C to X band range.
Current usage metrics show cumulative count of Article Views (full-text article views including HTML views, PDF and ePub downloads, according to the available data) and Abstracts Views on Vision4Press platform.
Data correspond to usage on the plateform after 2015. The current usage metrics is available 48-96 hours after online publication and is updated daily on week days.
Initial download of the metrics may take a while.