Fig. 6
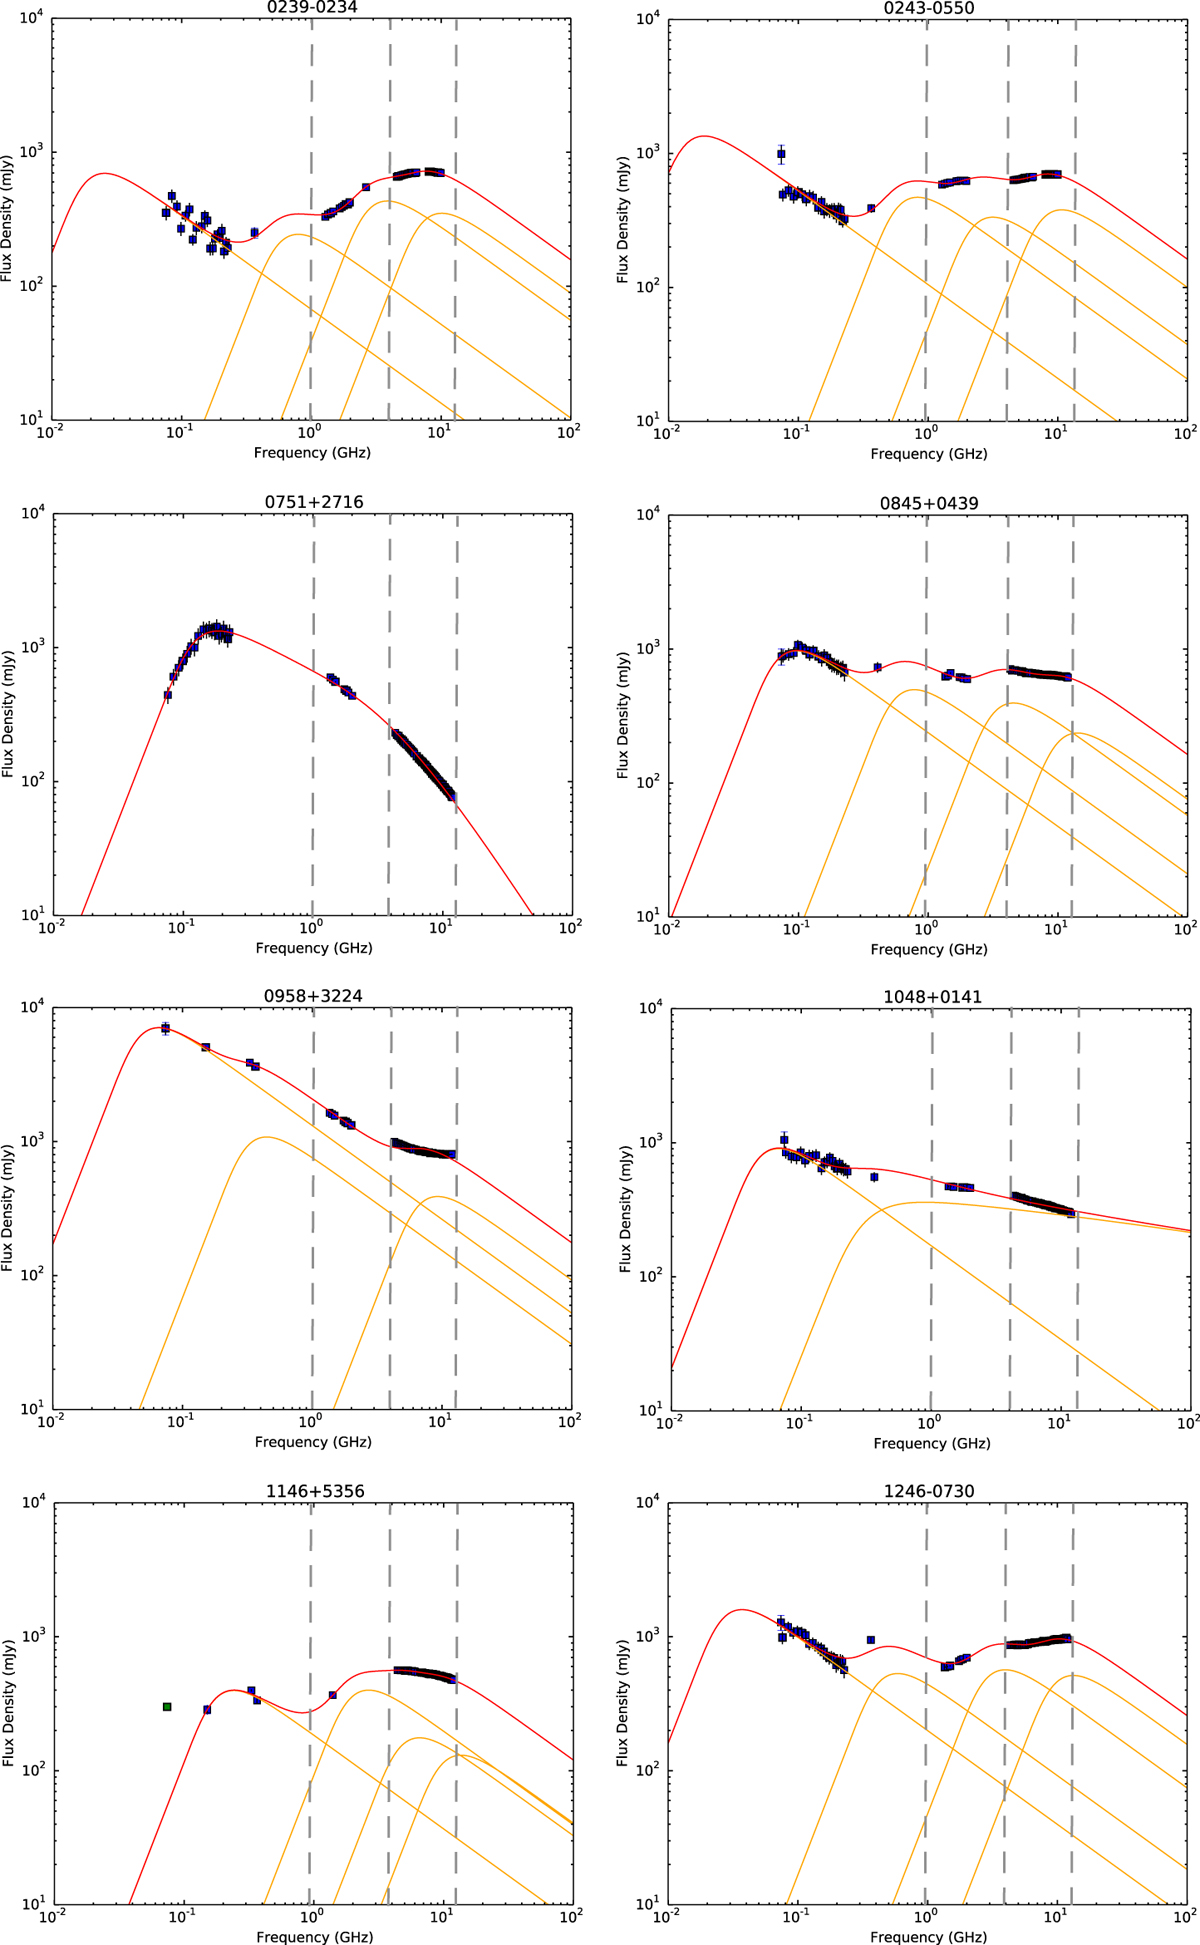
Radio spectra using L, C and X bands and literature. Total flux density is expressed in [mJy] and the frequency in [GHz]. Blue points are the JVLA and literature data and the green points are upper limits. Orange lines are the individual synchrotron componentsused for the radio spectra fit and the red line is their sum. The gray vertical dashed lines indicate the L to C band range and the C to X band range.
Current usage metrics show cumulative count of Article Views (full-text article views including HTML views, PDF and ePub downloads, according to the available data) and Abstracts Views on Vision4Press platform.
Data correspond to usage on the plateform after 2015. The current usage metrics is available 48-96 hours after online publication and is updated daily on week days.
Initial download of the metrics may take a while.