Fig. 10
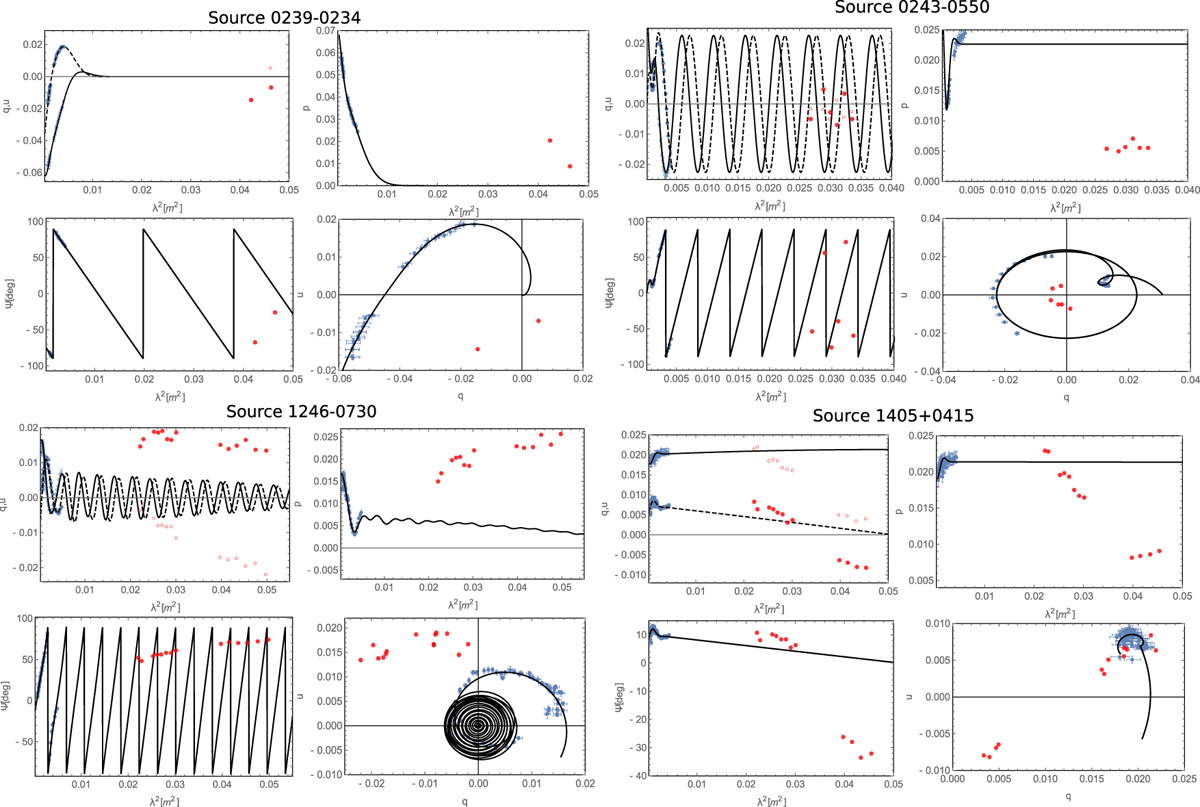
Depolarization models for the four sources at C and X bands with the L band data points over plotted. Shown for each source are behavior of the fractional Stokes parameters (q and u), the fractional polarization (p), and the polarization angle (χ) versus wavelength squared (λ2). Blue data points are for bands C and X, and red points are for L band. Black lines are the depolarization models fit considering bands C and X.
Current usage metrics show cumulative count of Article Views (full-text article views including HTML views, PDF and ePub downloads, according to the available data) and Abstracts Views on Vision4Press platform.
Data correspond to usage on the plateform after 2015. The current usage metrics is available 48-96 hours after online publication and is updated daily on week days.
Initial download of the metrics may take a while.