Fig. B.3
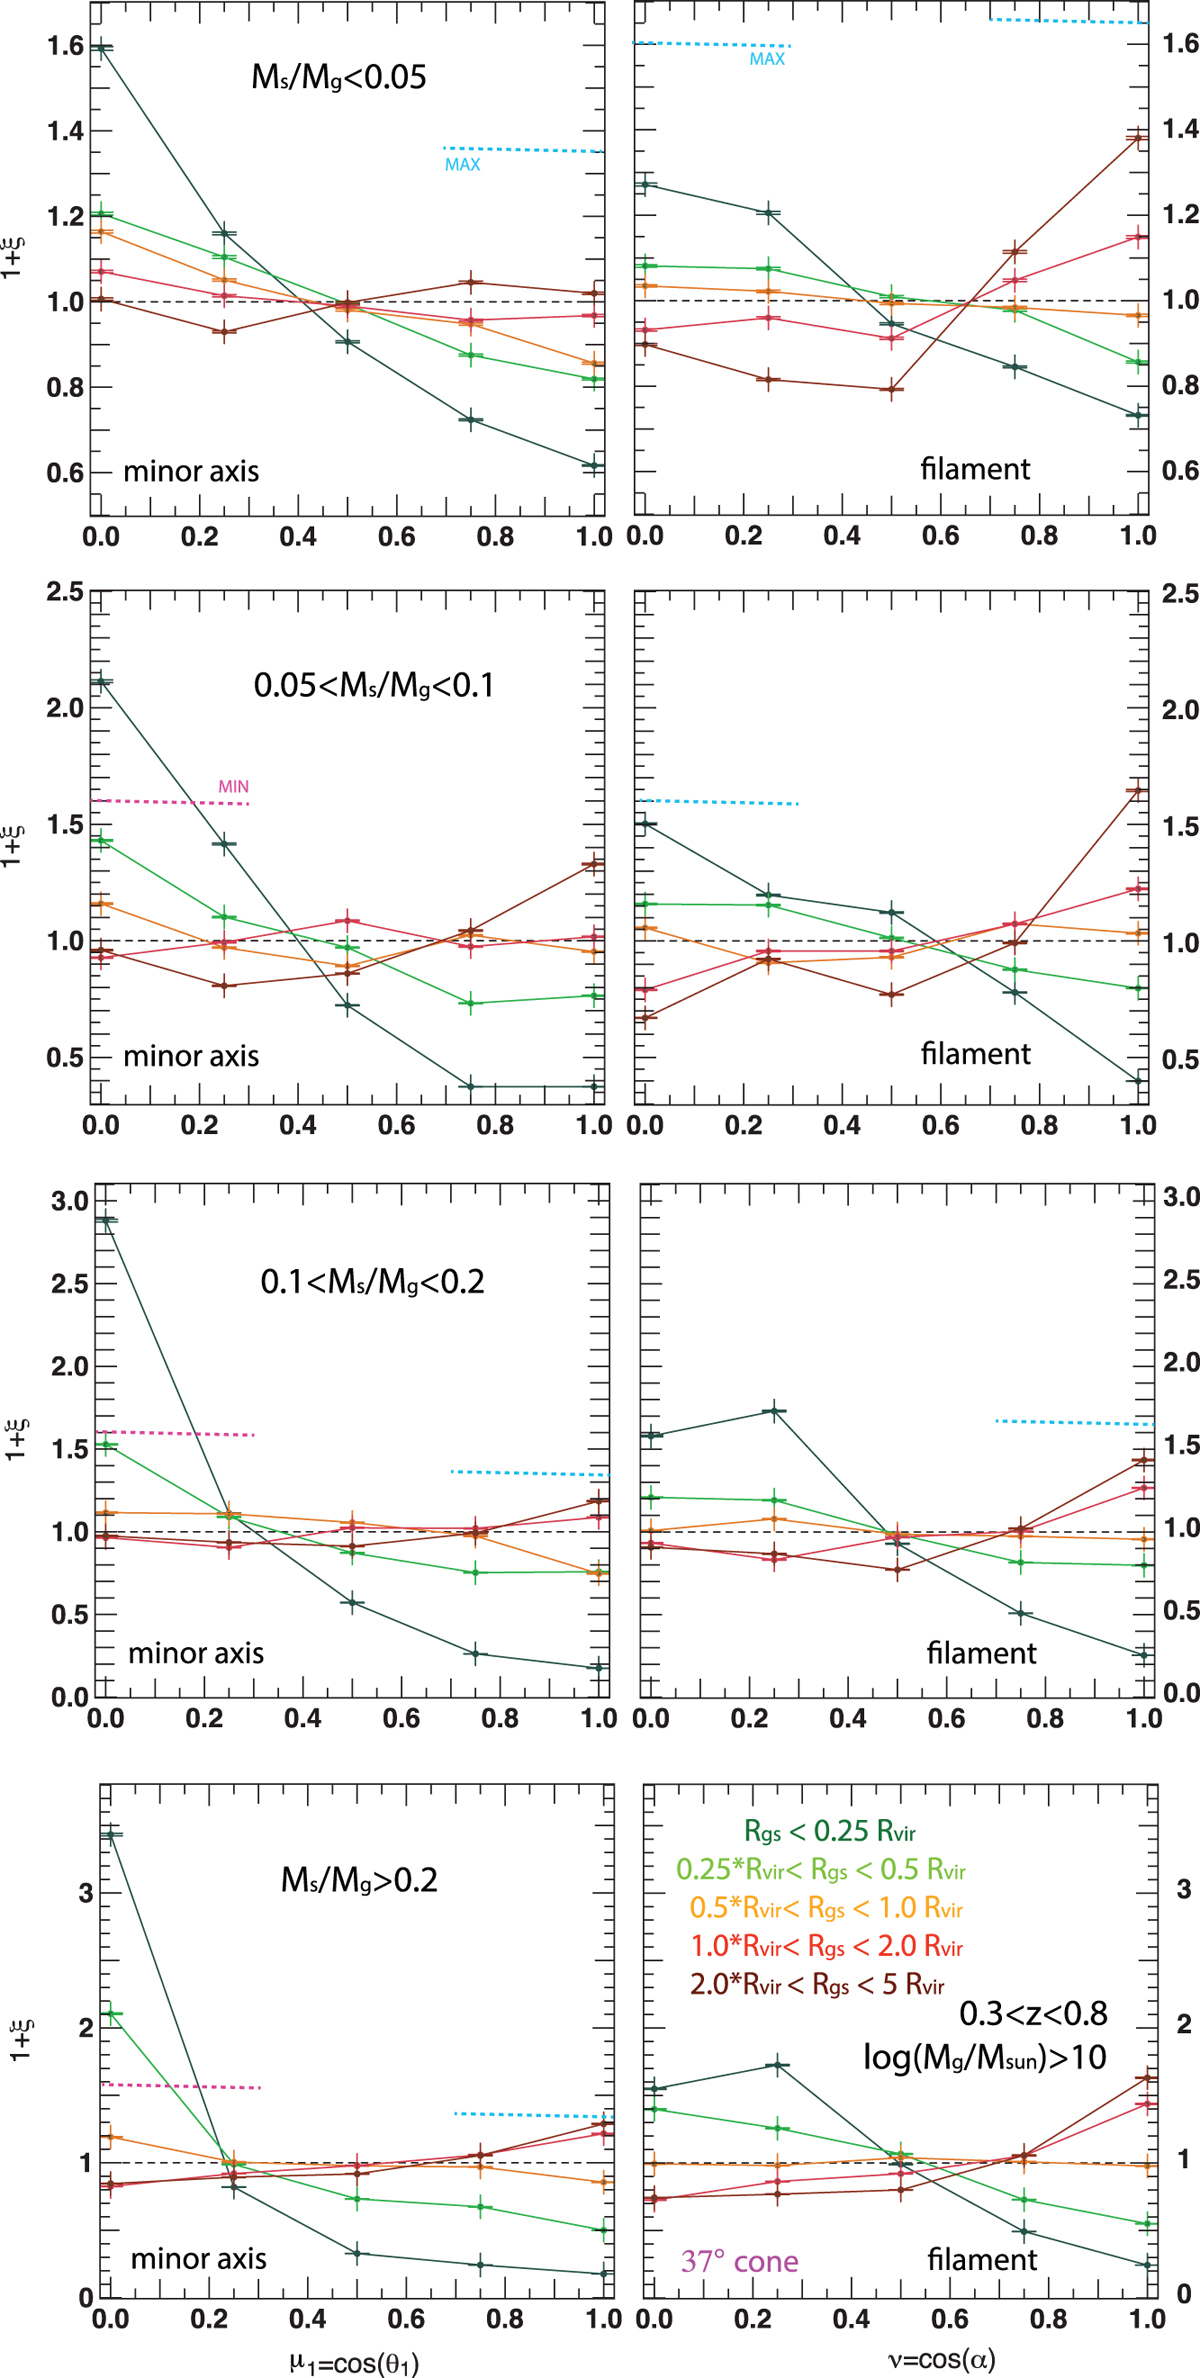
Same as Fig. 2 where samples are binned in distance, Rgs, from satellite to central. We restrict the sample to centrals with a minor axis aligned with the nearest filament (within a 37 degree cone).This is plotted for four different satellite-to-central stellar mass ratios Mg ∕Ms < 0.05 (top panels),0.05 < Mg∕Ms < 0.1 (upper intermediate panels), 0.1 < Mg∕Ms < 0.2 (lower intermediate panels) and Mg∕Ms > 0.2 (bottom panels). To help the eye, the maximal amplitude of the alignment signals across the four mass bins are represented as dotted blue lines in the plots obtained for stellar mass bins with weaker signal. The minimal amplitude of the orthogonality signal across the four mass bins is represented as a dotted pink line in the plots obtained for stellar mass bins with stronger signals. Results are stacked for 0.3 < z < 0.8.
Current usage metrics show cumulative count of Article Views (full-text article views including HTML views, PDF and ePub downloads, according to the available data) and Abstracts Views on Vision4Press platform.
Data correspond to usage on the plateform after 2015. The current usage metrics is available 48-96 hours after online publication and is updated daily on week days.
Initial download of the metrics may take a while.