Fig. B.2
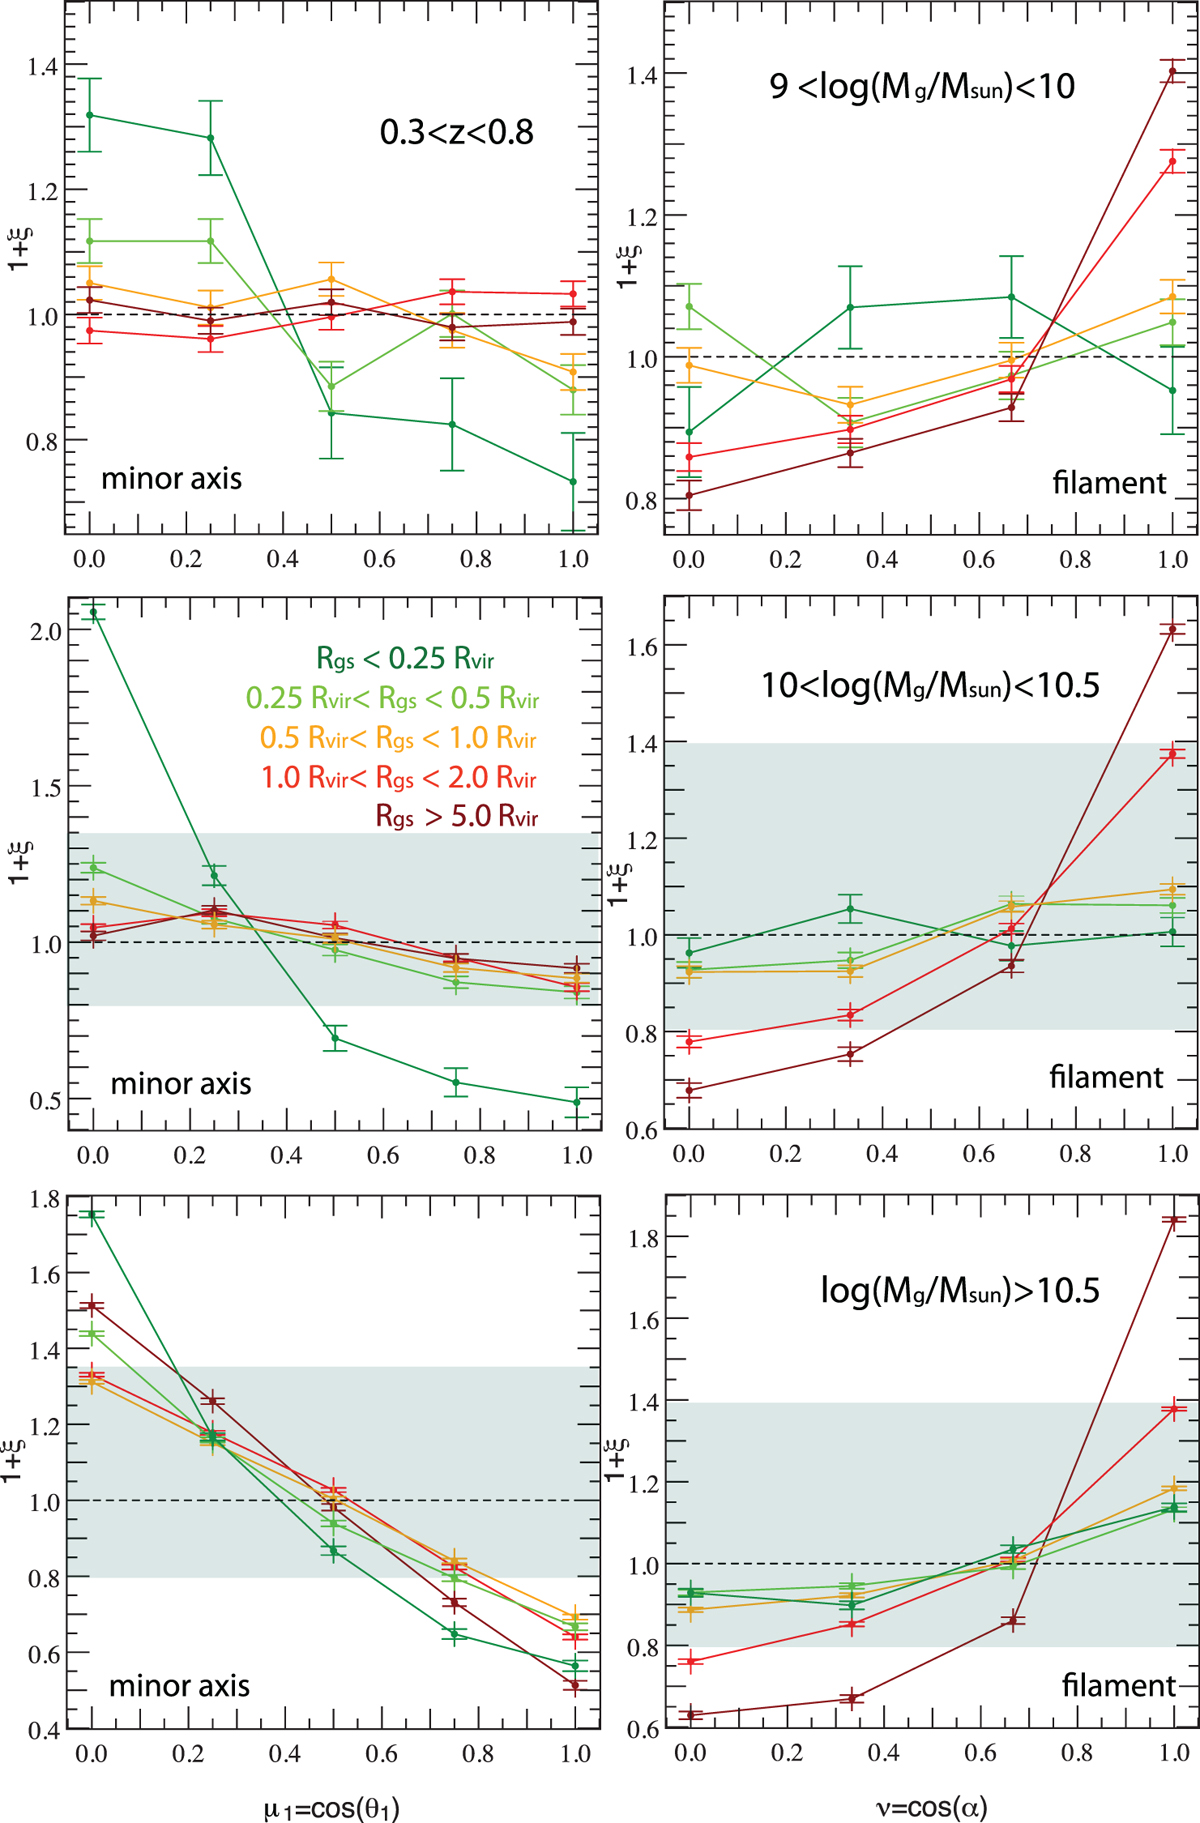
Same as Fig. 2 where samples are binned in distance, Rgs, from satellite to central. This is plotted for three different central stellar mass bins: 109 < Mg < 1010 M⊙ (top panels),1010 < Mg < 1010.5 M⊙ (middle panels) and Mg > 1010.5 M⊙ (bottom panels). The amplitude of the signal for the lowest mass bin (109 < Mg < 1010 M⊙) is represented as a grey area in the plots obtained for higher stellar mass bins. Satellites close to the central galaxy tend to be distributed on the galactic plane with marginal alignment to the filament, while satellites in the outskirt of the host halo of the central are strongly aligned with the filament but the coplanarity with the central galaxy is weakened. Results are stacked for 0.3 < z < 0.8.
Current usage metrics show cumulative count of Article Views (full-text article views including HTML views, PDF and ePub downloads, according to the available data) and Abstracts Views on Vision4Press platform.
Data correspond to usage on the plateform after 2015. The current usage metrics is available 48-96 hours after online publication and is updated daily on week days.
Initial download of the metrics may take a while.