Fig. A.1
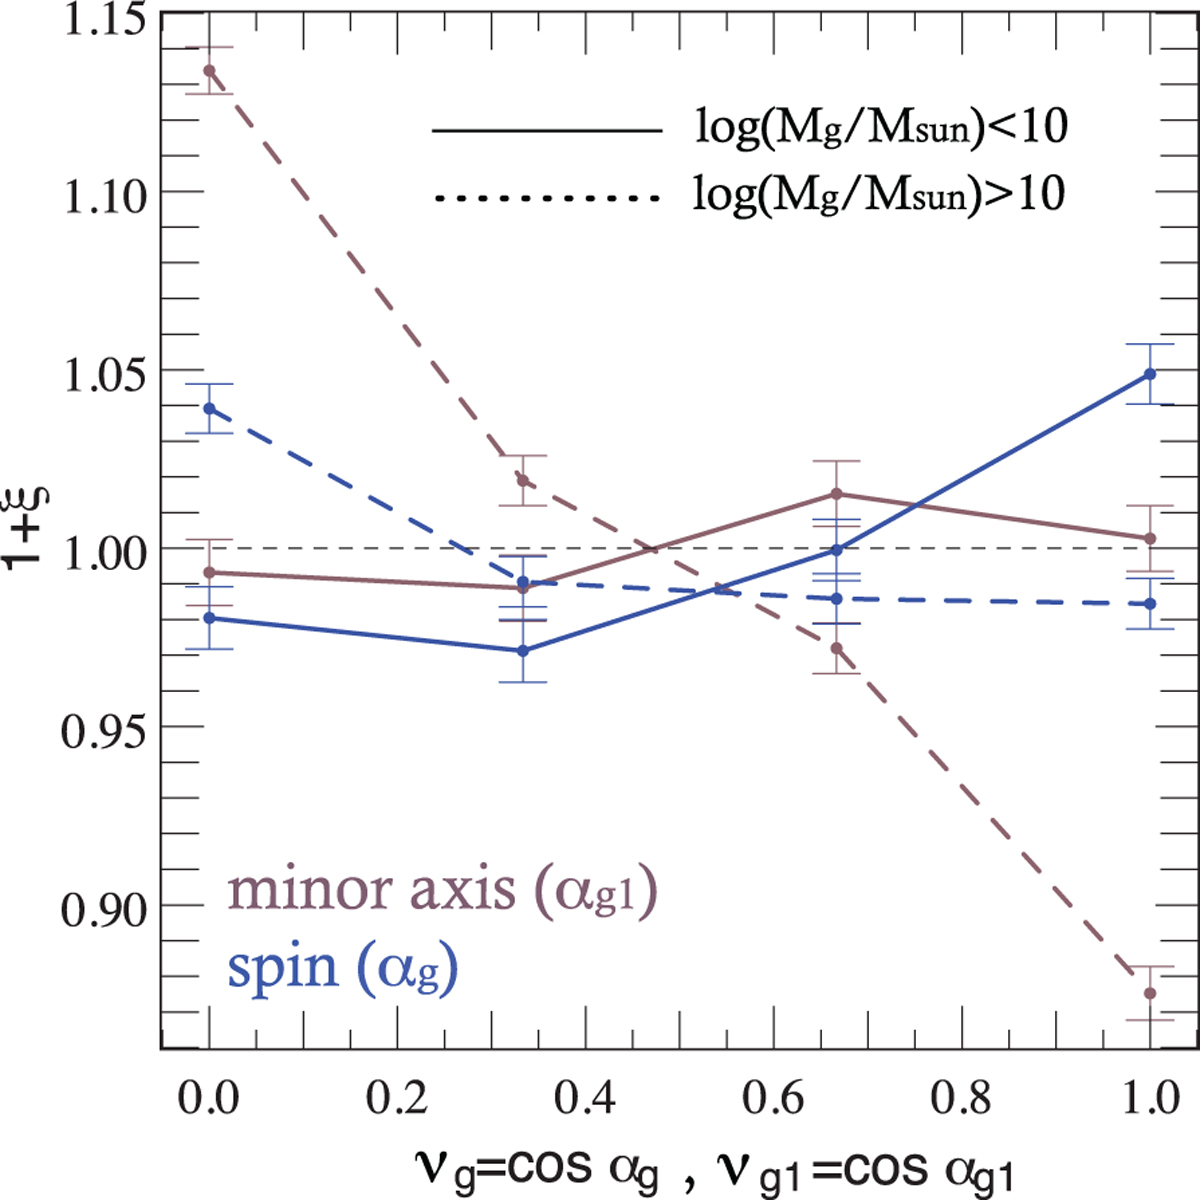
PDF of νg1 = cos αg1, the cosine ofthe angle between the minor axis of the central galaxy and the direction of the nearest filament (brown lines) and νg = cos αg, the angle between the spin of the central galaxy and the direction of the nearest filament (blue lines). Distributions are plotted for central galaxies in two different mass ranges: 109 < Mg < 1010 M⊙ (solid lines) and Mg > 1010 M⊙ (blue lines). The transition for the galactic plane orientation is recovered, but the signal is stronger using the spin for low-mass centrals. The opposite is true for high mass centrals: the minor axis estimator yields an increased amplitude in the excess probability ξ.
Current usage metrics show cumulative count of Article Views (full-text article views including HTML views, PDF and ePub downloads, according to the available data) and Abstracts Views on Vision4Press platform.
Data correspond to usage on the plateform after 2015. The current usage metrics is available 48-96 hours after online publication and is updated daily on week days.
Initial download of the metrics may take a while.