Fig. 2
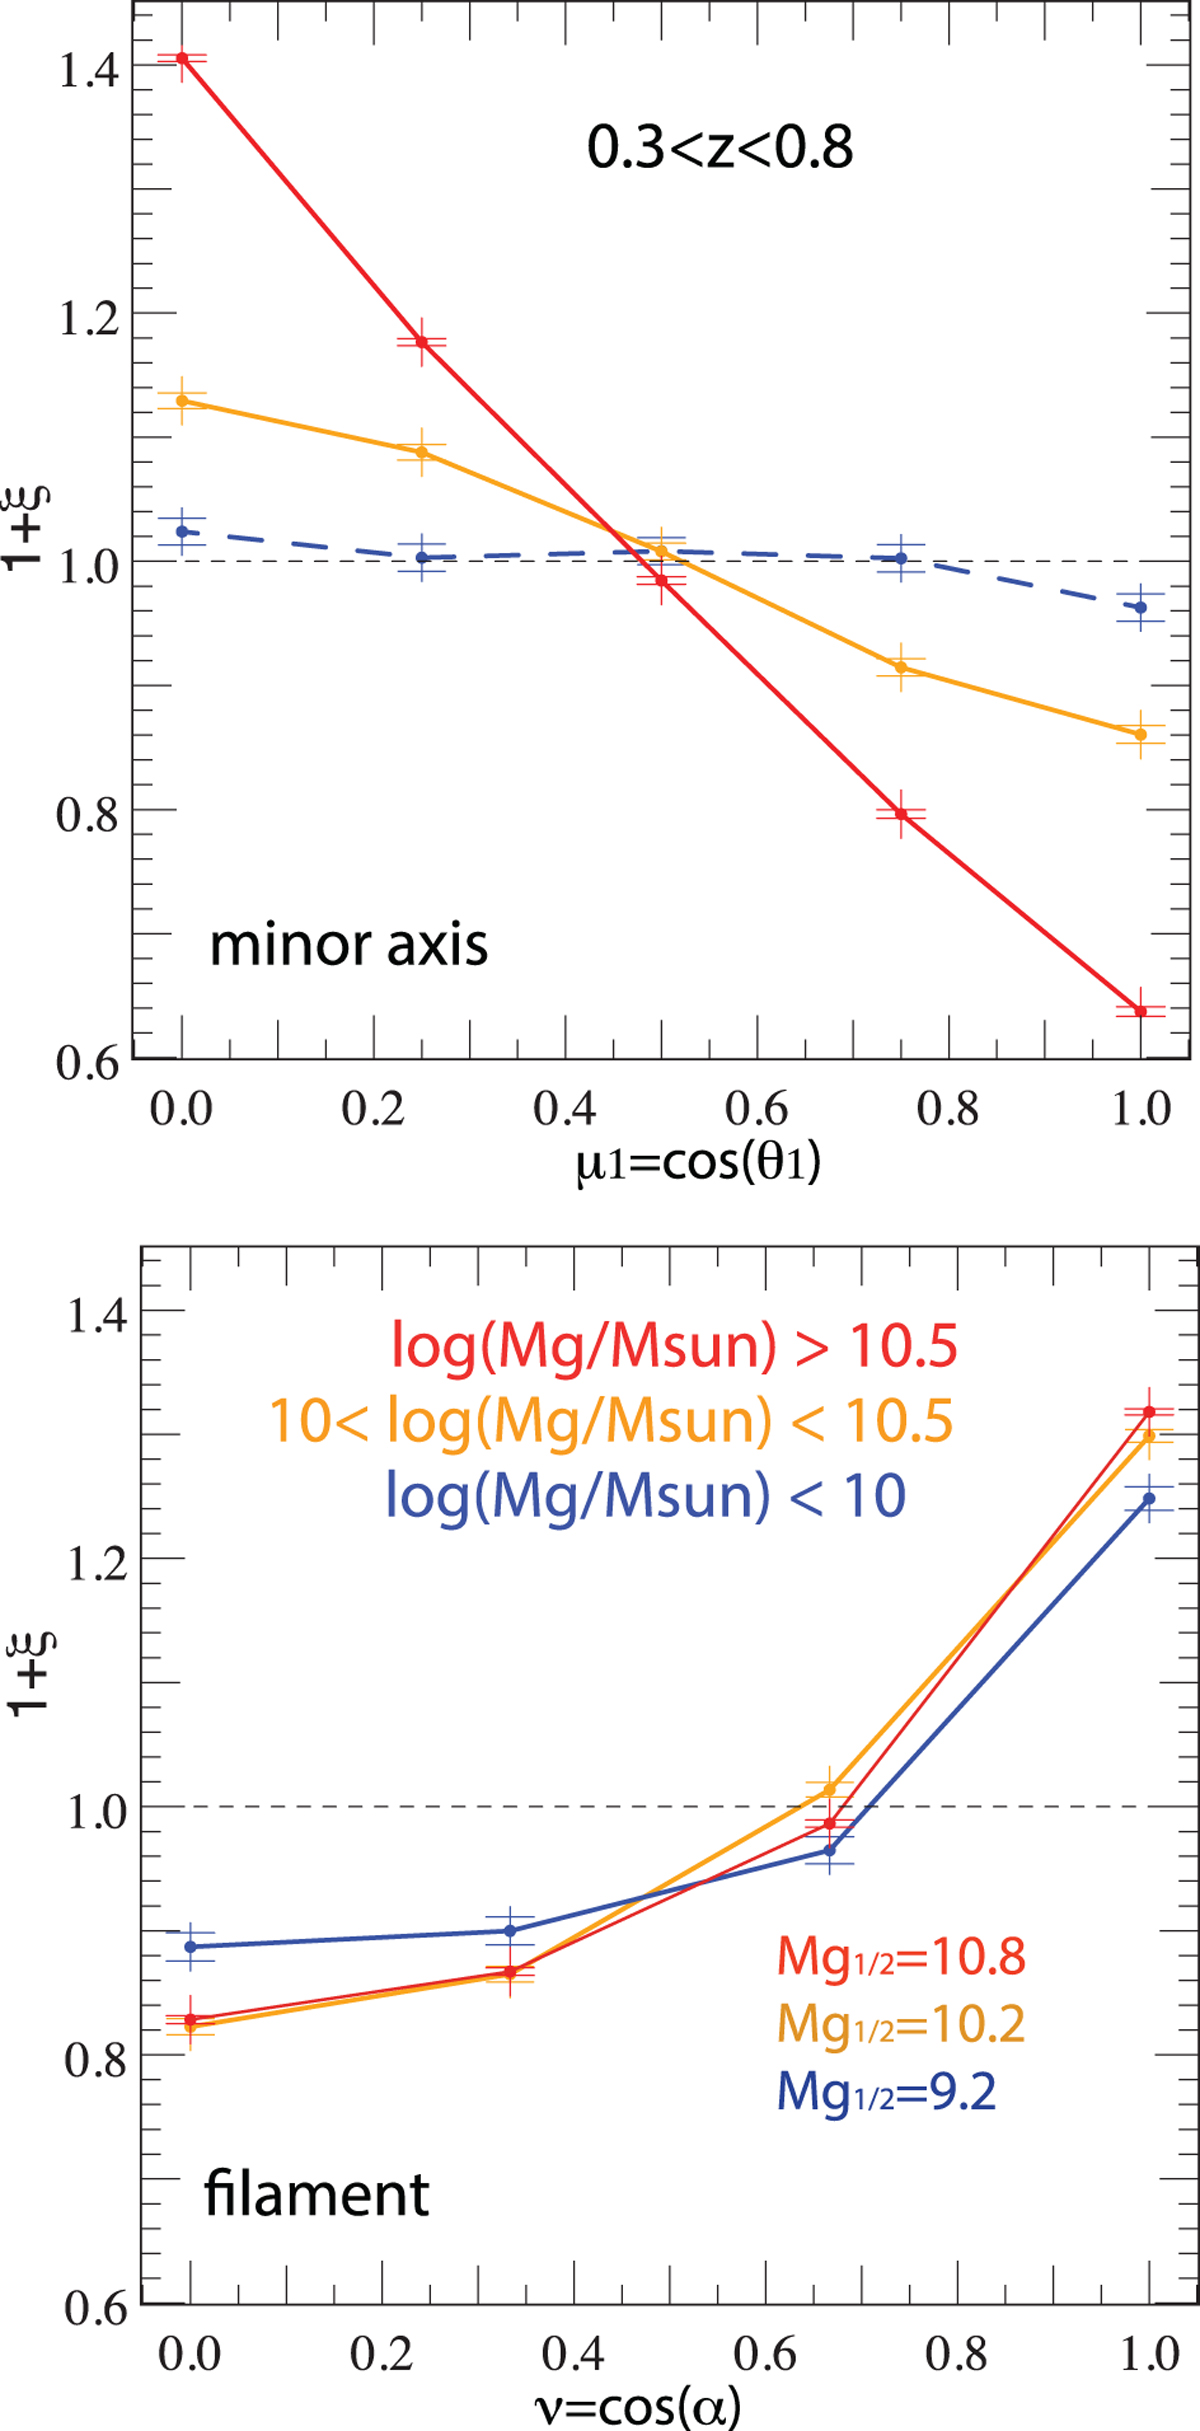
Top panel: excess PDF ξ of μ1 = cos θ1, the angle between the minor axis of the central galaxy and the direction towards the centre of mass of its satellites, for different central galaxy stellar mass bins, between redshift 0.3 < z < 0.8. Satellites tend to be distributed on the galactic plane of the central and this trend is stronger with the increasing mass of the central. Bottom panel: excess PDF of ν = cos α, the cosine of the angle between the direction of the central’s nearest filament axis and the direction towards the centre of mass of its satellites. Satellites tend to be strongly distributed along filaments. Error bars are 1− σ Poissonian error bars. ![]() indicates the median value in each mass bin.
indicates the median value in each mass bin.
Current usage metrics show cumulative count of Article Views (full-text article views including HTML views, PDF and ePub downloads, according to the available data) and Abstracts Views on Vision4Press platform.
Data correspond to usage on the plateform after 2015. The current usage metrics is available 48-96 hours after online publication and is updated daily on week days.
Initial download of the metrics may take a while.