Fig. 15
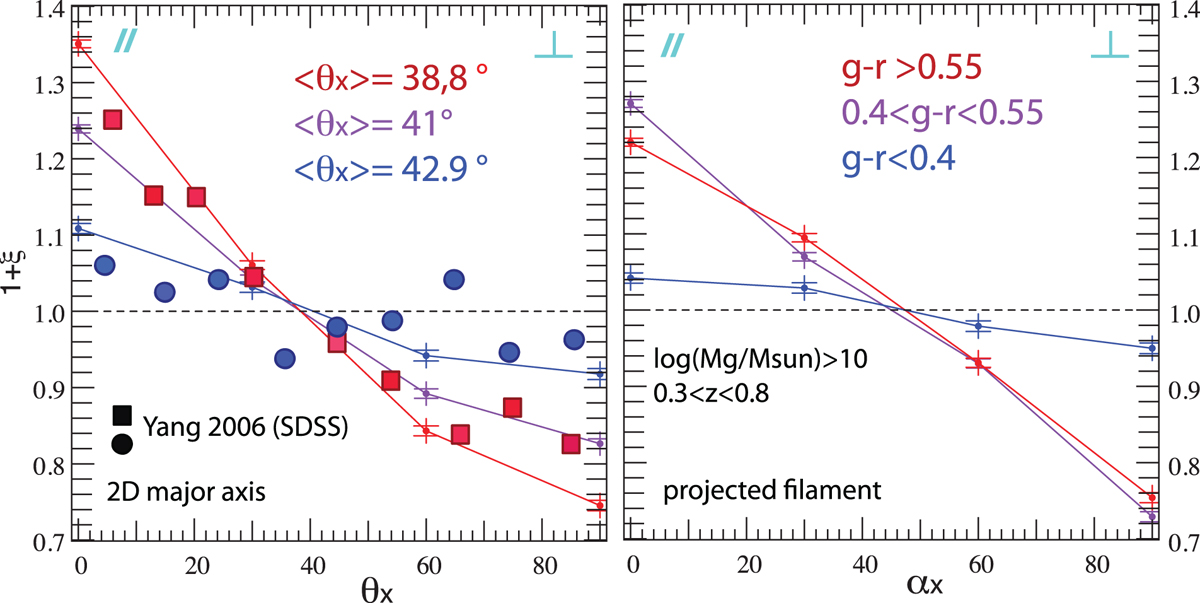
PDF of θx and αx, the angles between the x-projected major axis of, respectively, the central galaxy (left panel), and direction of the filament (right panel) and the x-projected rgs, at 0.3 < z < 0.8 for differentcolour bins. For massive red central galaxies, the satellites tend to be distributed on the galactic plane. The projected signal is qualitatively comparable to results in 3D. Observational results from Yang et al. (2006) are overplotted for red centrals (red squares) and blue centrals (blue dots). The agreement is good.
Current usage metrics show cumulative count of Article Views (full-text article views including HTML views, PDF and ePub downloads, according to the available data) and Abstracts Views on Vision4Press platform.
Data correspond to usage on the plateform after 2015. The current usage metrics is available 48-96 hours after online publication and is updated daily on week days.
Initial download of the metrics may take a while.