| Issue |
A&A
Volume 613, May 2018
|
|
|---|---|---|
| Article Number | C1 | |
| Number of page(s) | 5 | |
| Section | Galactic structure, stellar clusters and populations | |
| DOI | https://doi.org/10.1051/0004-6361/200913413e | |
| Published online | 25 May 2018 | |
Corrigendum
A high-resolution VLT/FLAMES study of individual stars in the centre of the Fornax dwarf spheroidal galaxy (Corrigendum)★
1
Kapteyn Astronomical Institute, University of Groningen,
P.O. Box 800,
9700AV
Groningen, The Netherlands
2
California Institute of Technology,
1200 E. California Blvd, MC105-24,
Pasadena,
CA
91125, USA
3
South African Astronomical Observatory,
P.O. Box 9,
Observatory
7935, South Africa
e-mail: This email address is being protected from spambots. You need JavaScript enabled to view it.
4
GEPI, Observatoire de Paris, CNRS, Université Paris Diderot,
92125
Meudon
Cedex, France
5
Université de Nice Sophia-Antipolis, CNRS,
Observatoire de Côte d’Azur, Laboratoire Cassiopée,
06304
Nice Cedex 4, France
6
Observatoire de Genève, Université de Genèva,
1290
Sauverny, Switzerland
7
McDonald Observatory, University of Texas,
Fort Davis,
TX
79734, USA
8
Dept. of Physics & Astronomy, University of Victoria,
3800 Finerty Road,
Victoria,
BC
V8P 1A1, Canada
9
Institute of Astronomy, University of Cambridge,
Madingley Road,
Cambridge
CB3 0HA, UK
10
European Southern Observatory,
Karl-Schwarzschild-str. 2,
85748
Garching bei München, Germany
11
European Southern Observatory,
Alonso de Cordova,
3107
Santiago, Chile
12
National Astronomical Observatory of Japan,
2-21-1 Osawa, Mitaka,
Tokyo
181-8588, Japan
13
Astronomical Institute, Osaka Kyoiku University,
Asahigaoka, Kashiwara,
Osaka
582-8582, Japan
Received:
25
January
2018
Accepted:
26
January
2018
Key words: stars: abundances / galaxies: dwarf / galaxies: evolution / galaxies: formation / galaxies: stellar content / errata, addenda
Based on FLAMES observations collected at the European Southern Observatory, proposal number 171.B-0588.
1 Introduction
Due to an unfortunate typo in Fortran I/O formats, incorrect values of the collisional broadening coefficient were passed to the spectral synthesis code (CALRAI) in our analysis of Fornax red giants stars. Furthermore, we realized that the lanthanum in tables and figures had escaped the HFS corrections described in Sect. 3.5 of the paper. Here we provide an updated table with all corrected abundances for 72 Fornax stars. The changes are small and non-systematic for most elements, except barium and lanthanum where they are more visible. We thus also reproduce here Figs. 8, 14, 16, and 20 which are the only figures with visible changes. All of our conclusions still hold, although for Ba and La, the overabundance with respect to the Milky Way are of a smaller magnitude than originally published.
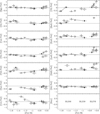 |
Fig. 8 Abundance ratios for the three stars observed with both UVES (S03) and GIRAFFE (this work) are for the five different checks discussed in Sect. 3.6. These are intented to check the effect of systematics in our analysis. To see which star is which, see the bottom right-hand panel. The GIRAFFE data points are shown as filled circles with lines joining each different check for the same star. The UVES abundances are shown as open symbols. Check 1 results are shown as inverted triangles; Check 2 as triangles; Check 3 as diamonds; Check 4 as circles and Check 5 as small filled dots. |
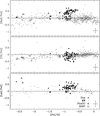 |
Fig. 14 s-process elements [Ba/Fe], [Y/Fe], and [La/Fe] plotted against [Fe/H] for the Fornax field stars. Also plotted for comparison are Galactic stars (original references in Venn et al. 2004) as small grey squares, the Fornax globular clusters (Letarte et al. 2006) as triangles and eight peculiar halo stars (Nissen & Schuster 1997) as empty squares. In addition we use data from Johnson (2002) and Simmerer et al. (2004) for [La/Fe]. There is a representative (average) error bar for the Fornax field star abundances in the bottom right corner of each panel. This is the quadratic sum of [X/H] + [Fe/H], (measurement errors) taken from Table A.5. |
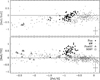 |
Fig. 16 [Ba/Eu] and [Ba/Y] as a function of [Fe/H] for the Fornax field stars as well as Fornax globulars and MW compilation,as seen in Fig. 14. |
2 Numerical values in Table A.5
Key changes from Letarte et al. (2010): the collisional broadening coefficient typo caused the abundance derived from strong lines to be overestimated. Although in principle this concerns all lines, because of our line selection, the net effect on mean abundances is mostly visible for barium abundances, in metal-rich stars. The lack of HFS correction on lanthanum lines alters the La abundances slightly, essentially in metal-rich stars. Quantitatively, the average shift (driven by the metal-rich end of our sample) in [Ba/Fe] is about 0.2 dex (σ 0.1) and [La/Fe] is 0.1 dex (σ 0.07). All the other elements are affected by an average of less than 0.04 dex. Table A.5 is reproduced here to update the numerical values for all elements in the sample.
The total number of stars that passed all quality tests (see Sect. 3.3 of the original paper) is 72, as compared to the 81 stars in the original paper. This change is due to slightly inflated uncertainties on some of the diagnostics (slopes with excitation potential or line strength, ionization equilibrium). Tables and figures in this corrigendum therefore only include these 72 Fornax stars.
3 Updated figures
Figures 8, 14, 16, and 20 are reproduced here with the updated abundances to highlight the most visible changes in Ba and La abundances. The effect however changes neither the global trends, nor our interpretation. For barium, our abundances are still higher than those of the Milky Way, but of a smaller amplitude than we first published. For lanthanum too, the overabundance of Fornax with respect to the Milky-Way is reduced.
As illustrated by the revised Fig. 20, the new, lower Ba abundances in Fornax reduce the potential s-process content of Eu in Fornax, and furthermore no longer allow us to discriminate between the set of different metallicity AGBs yields (Cristallo et al. 2009) for the production of the s-process in Fornax. The final paragraph of Sect. 5.3 should therefore be ignored.
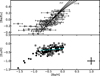 |
Fig. 20 [Eu/H] and [Ba/Eu] versus [Ba/H]. Upper panel: Expected evolution of [Ba/Eu] as a function of [Ba/H] when the evolution of Ba and Eu are triggered by AGB winds only, starting at [Ba/H] = − 0.78 and [Ba/Eu] = − 0.4. The five solid lines follow the chemical evolution induced by the AGB models of Cristallo et al. (2009) at different metallicities ([Z∕Z⊙]), which values are indicated close to the upper edges of the model lines. The Fornax sample stars from this work are shown in open circles, together with the individual error bars in [Ba/H]. Lower panel: Black points show the observations of Fornax stars from this work. The solid line traces the locus of the evolution in Eu and Ba induced by the yields of [Z∕Z⊙ ] = − 2.14 AGBs (Cristallo et al. 2009), starting at [Ba/H] = − 0.78 and [Ba/Eu] = − 0.4. The black open squares are 85 random trials taking into account the mean observational errors, 0.15 dex in [Ba/H] and 0.19 dex in [Eu/H] indicated at the bottom right of the frame. They show the scattering of the single model line induced by the observational uncertainties only. |
Abundance ratio of the Fornax Field stars.
continued.
References
- Cristallo, S., Straniero, O., Gallino, R., et al. 2009, ApJ, 696, 797 [NASA ADS] [CrossRef] [Google Scholar]
- Johnson, J. A. 2002, ApJS, 139, 219 [NASA ADS] [CrossRef] [Google Scholar]
- Letarte, B., Hill, V., Jablonka, P., et al. 2006, A&A, 453, 547 [NASA ADS] [CrossRef] [EDP Sciences] [Google Scholar]
- Letarte, B., Hill, V., Tolstoy, E., et al. 2010, A&A, 523, A17 [NASA ADS] [CrossRef] [EDP Sciences] [Google Scholar]
- Nissen, P. E., & Schuster, W. J. 1997, A&A, 326, 751 [NASA ADS] [Google Scholar]
- Simmerer, J., Sneden, C., Cowan, J. J., et al. 2004, ApJ, 617, 1091 [NASA ADS] [CrossRef] [Google Scholar]
- Venn, K. A., Irwin, M., Shetrone, M. D., et al. 2004, AJ, 128, 1177 [NASA ADS] [CrossRef] [Google Scholar]
© ESO 2018
All Tables
All Figures
|
Fig. 8 Abundance ratios for the three stars observed with both UVES (S03) and GIRAFFE (this work) are for the five different checks discussed in Sect. 3.6. These are intented to check the effect of systematics in our analysis. To see which star is which, see the bottom right-hand panel. The GIRAFFE data points are shown as filled circles with lines joining each different check for the same star. The UVES abundances are shown as open symbols. Check 1 results are shown as inverted triangles; Check 2 as triangles; Check 3 as diamonds; Check 4 as circles and Check 5 as small filled dots. |
| In the text | |
|
Fig. 14 s-process elements [Ba/Fe], [Y/Fe], and [La/Fe] plotted against [Fe/H] for the Fornax field stars. Also plotted for comparison are Galactic stars (original references in Venn et al. 2004) as small grey squares, the Fornax globular clusters (Letarte et al. 2006) as triangles and eight peculiar halo stars (Nissen & Schuster 1997) as empty squares. In addition we use data from Johnson (2002) and Simmerer et al. (2004) for [La/Fe]. There is a representative (average) error bar for the Fornax field star abundances in the bottom right corner of each panel. This is the quadratic sum of [X/H] + [Fe/H], (measurement errors) taken from Table A.5. |
| In the text | |
|
Fig. 16 [Ba/Eu] and [Ba/Y] as a function of [Fe/H] for the Fornax field stars as well as Fornax globulars and MW compilation,as seen in Fig. 14. |
| In the text | |
|
Fig. 20 [Eu/H] and [Ba/Eu] versus [Ba/H]. Upper panel: Expected evolution of [Ba/Eu] as a function of [Ba/H] when the evolution of Ba and Eu are triggered by AGB winds only, starting at [Ba/H] = − 0.78 and [Ba/Eu] = − 0.4. The five solid lines follow the chemical evolution induced by the AGB models of Cristallo et al. (2009) at different metallicities ([Z∕Z⊙]), which values are indicated close to the upper edges of the model lines. The Fornax sample stars from this work are shown in open circles, together with the individual error bars in [Ba/H]. Lower panel: Black points show the observations of Fornax stars from this work. The solid line traces the locus of the evolution in Eu and Ba induced by the yields of [Z∕Z⊙ ] = − 2.14 AGBs (Cristallo et al. 2009), starting at [Ba/H] = − 0.78 and [Ba/Eu] = − 0.4. The black open squares are 85 random trials taking into account the mean observational errors, 0.15 dex in [Ba/H] and 0.19 dex in [Eu/H] indicated at the bottom right of the frame. They show the scattering of the single model line induced by the observational uncertainties only. |
| In the text | |
Current usage metrics show cumulative count of Article Views (full-text article views including HTML views, PDF and ePub downloads, according to the available data) and Abstracts Views on Vision4Press platform.
Data correspond to usage on the plateform after 2015. The current usage metrics is available 48-96 hours after online publication and is updated daily on week days.
Initial download of the metrics may take a while.