Fig. 8
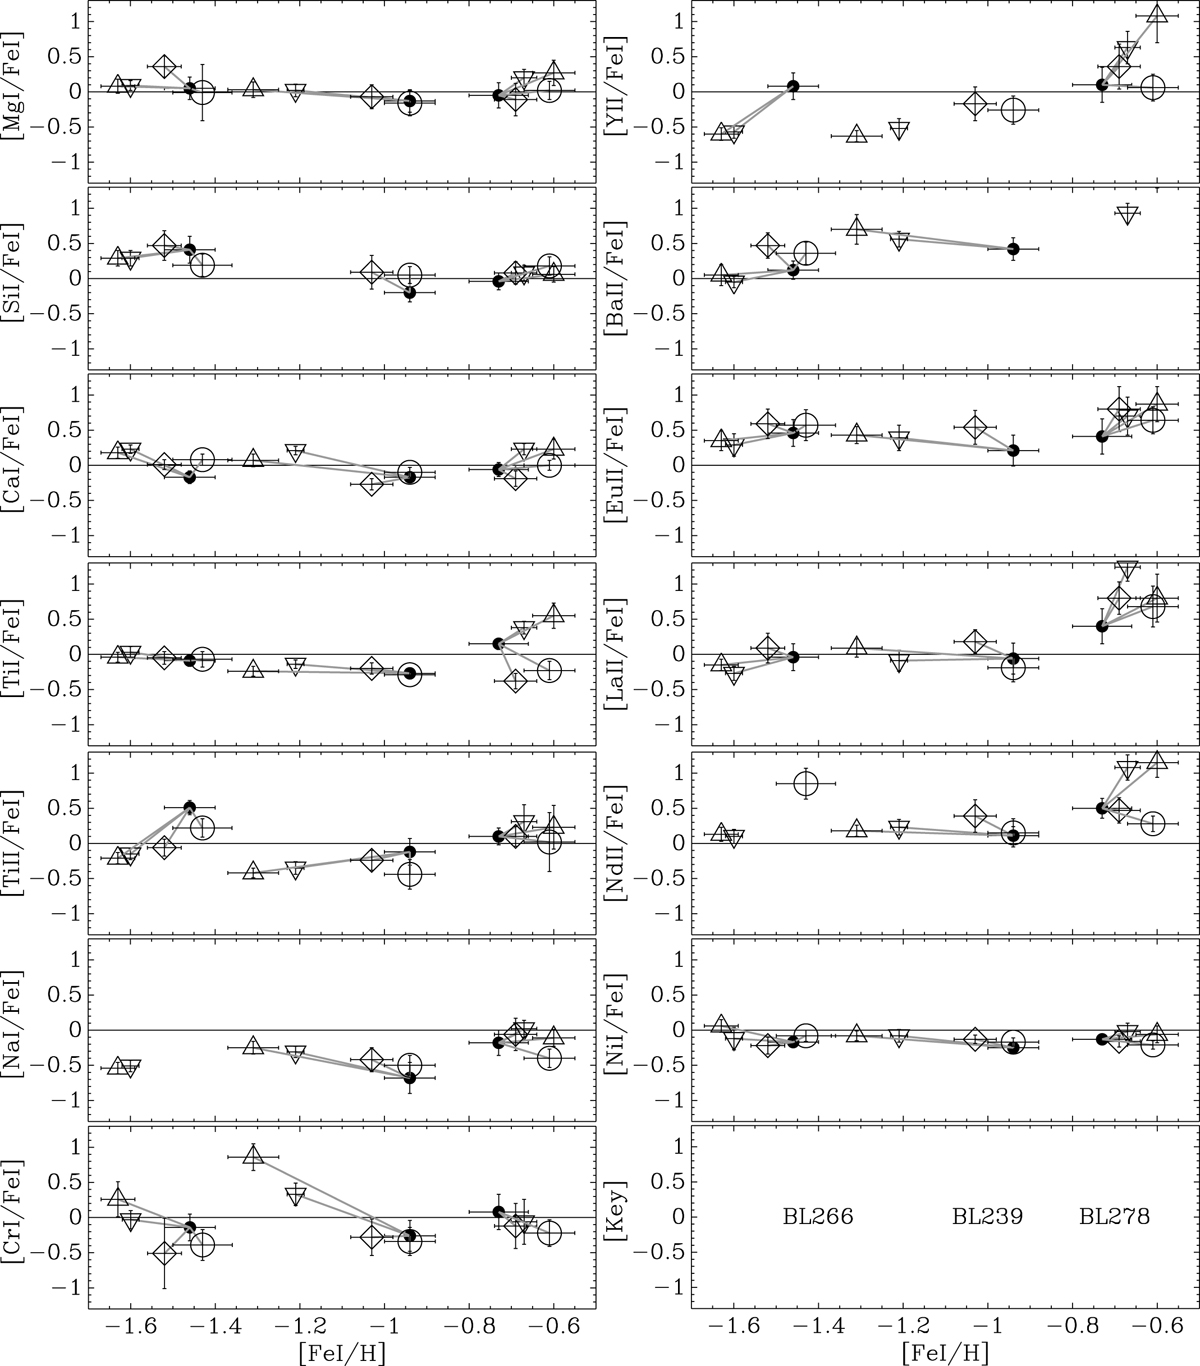
Abundance ratios for the three stars observed with both UVES (S03) and GIRAFFE (this work) are for the five different checks discussed in Sect. 3.6. These are intented to check the effect of systematics in our analysis. To see which star is which, see the bottom right-hand panel. The GIRAFFE data points are shown as filled circles with lines joining each different check for the same star. The UVES abundances are shown as open symbols. Check 1 results are shown as inverted triangles; Check 2 as triangles; Check 3 as diamonds; Check 4 as circles and Check 5 as small filled dots.
Current usage metrics show cumulative count of Article Views (full-text article views including HTML views, PDF and ePub downloads, according to the available data) and Abstracts Views on Vision4Press platform.
Data correspond to usage on the plateform after 2015. The current usage metrics is available 48-96 hours after online publication and is updated daily on week days.
Initial download of the metrics may take a while.