Fig. 7
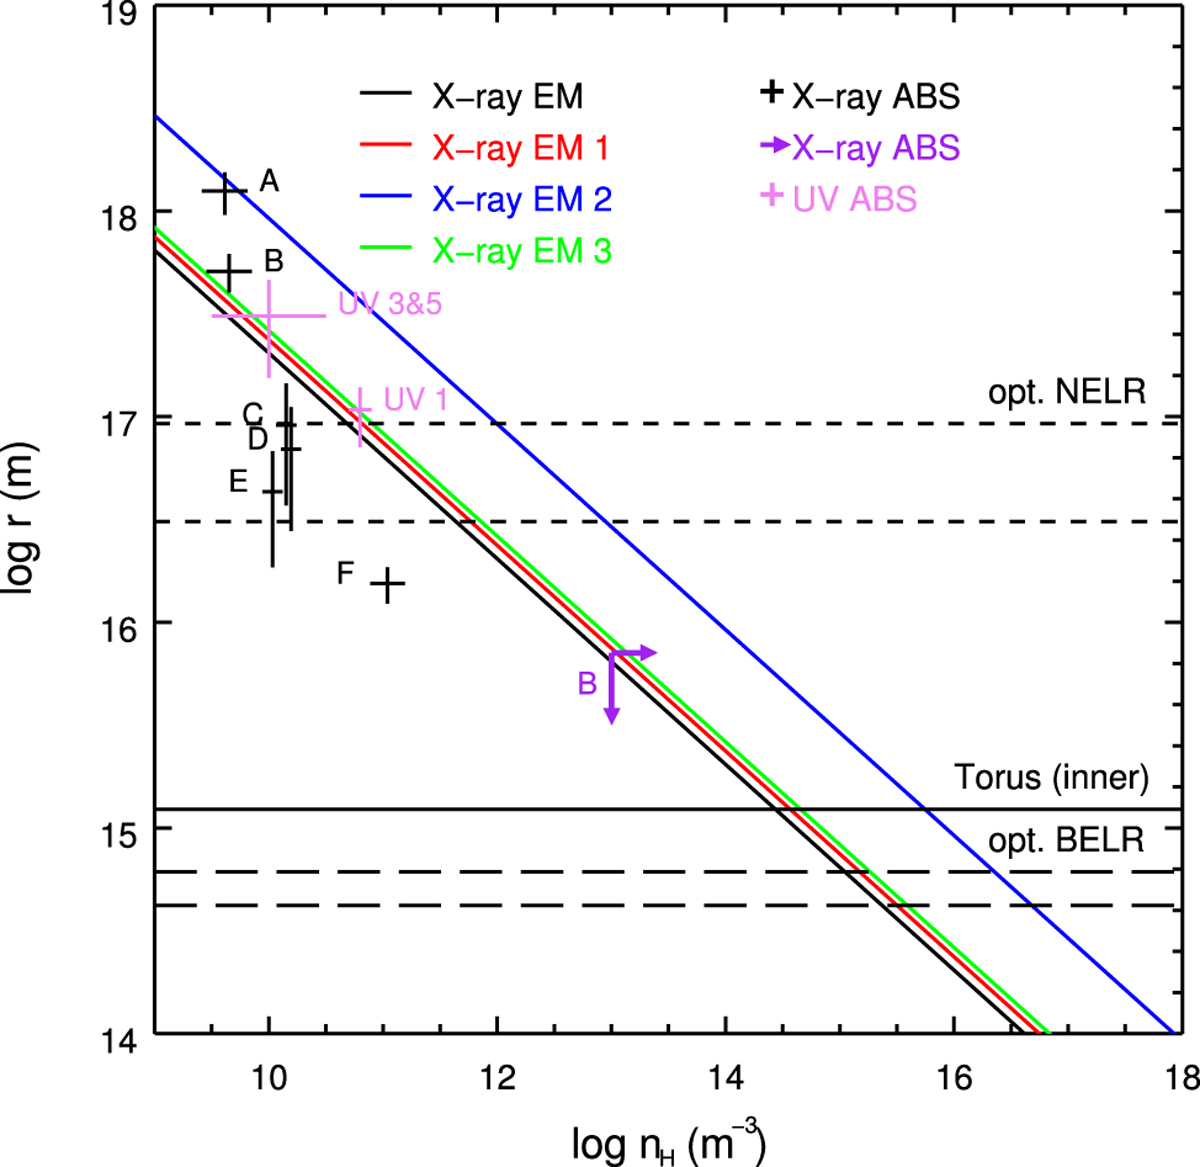
Distance and number density of optical, UV and X-ray emission and/or absorption components in NGC 5548. The solid diagonal lines are the distance and density relations (i.e. log ξ =L∕nHr2) of the X-ray emission components (EM for Whewell et al. 2015, and EM 1–3 for Model T). The black pluses (1σ uncertainties) refer to the six warm absorber components (via a timing analysis, Ebrero et al. 2016). The purple arrows are the 3σ upper (distance) and lower (density) limits of the warm absorber component B (via a spectral analysis, Mao et al. 2017). The pink pluses are for the UV absorption components (Arav et al. 2015). The horizontal short dashed lines refer to the optical narrow emission line region (Peterson et al. 2013). The horizontal long dashed lines refer to the optical broad emission line region (Kaspi et al. 2000; Bottorff et al. 2002). The horizontal dotted line indicates the inner edge of the torus (Suganuma et al. 2006).
Current usage metrics show cumulative count of Article Views (full-text article views including HTML views, PDF and ePub downloads, according to the available data) and Abstracts Views on Vision4Press platform.
Data correspond to usage on the plateform after 2015. The current usage metrics is available 48-96 hours after online publication and is updated daily on week days.
Initial download of the metrics may take a while.