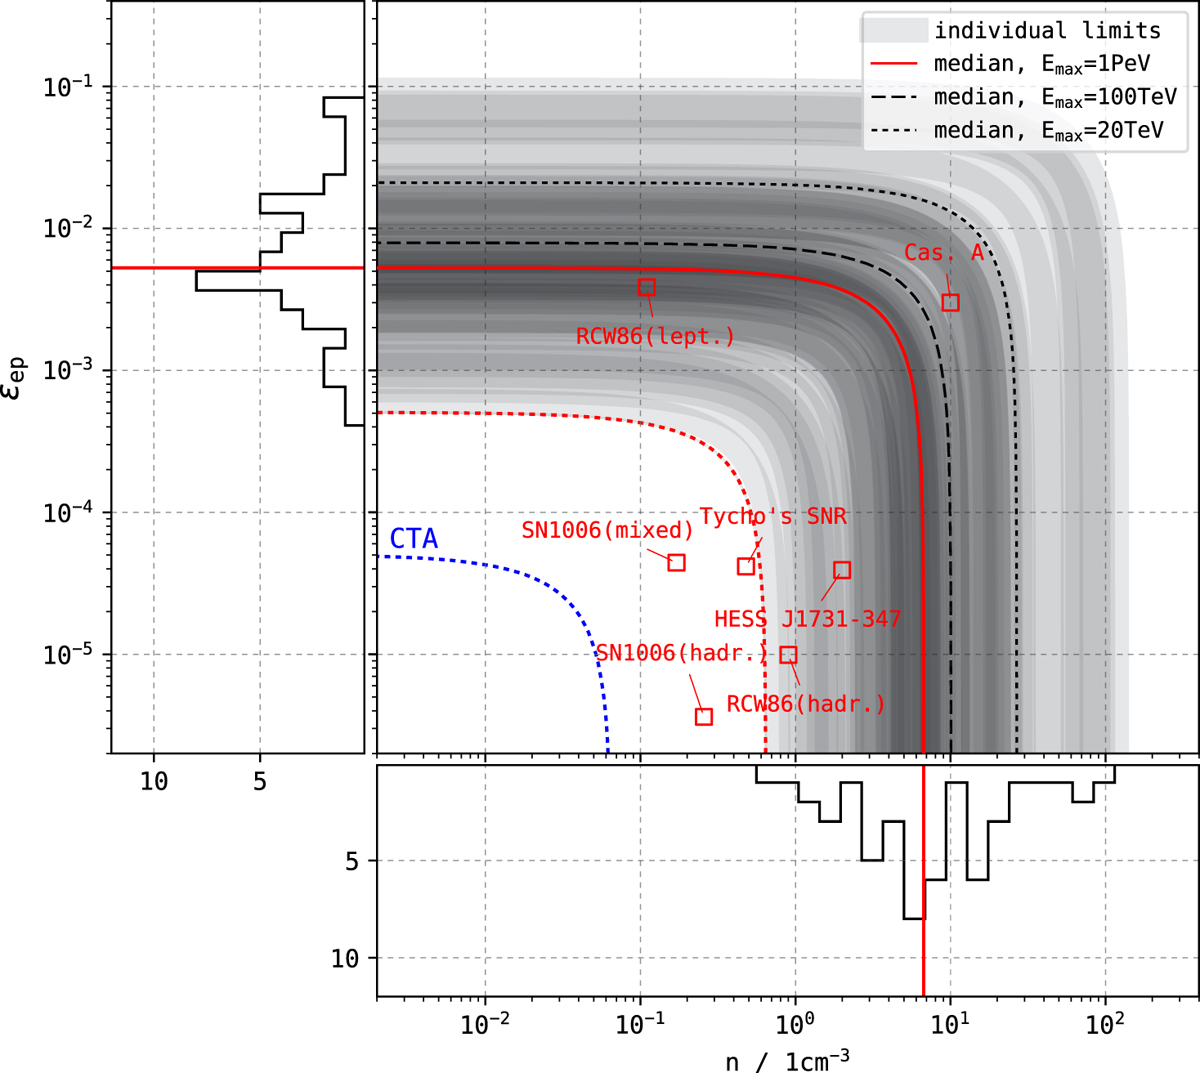
Fig. 9
Constraints on the ϵep and n parameter space as imposed by the flux upper limits (grey bands, each limit constitutes one band). For each constraint a source-intrinsic power-law spectrum with index Γ = 2.3 was assumed. Solid and dotted red lines represent the constraints corresponding to the median and lowest value of the flux upper limit distribution, respectively. The blue line indicates the boundary above which CTA might be able to probe the parameter space, assuming a ten times higher sensitivity than H.E.S.S. and taking the lowest flux upper limit as a reference. Additionally, values of ϵep and n for VHE-detected shell-type SNRs are shown, extracted from the publications in Table A.3. For better comparison, these values are rescaled to the canonical total CR energy in SNRs of 1050 erg. The dashed and dotted black lines indicate how the median of the distribution shifts if one limits the maximum proton energy to 100 TeV and 20 TeV, respectively. The histograms show the parameter limit distributions in the extreme hadronic- and leptonic-dominated scenarios.
Current usage metrics show cumulative count of Article Views (full-text article views including HTML views, PDF and ePub downloads, according to the available data) and Abstracts Views on Vision4Press platform.
Data correspond to usage on the plateform after 2015. The current usage metrics is available 48-96 hours after online publication and is updated daily on week days.
Initial download of the metrics may take a while.