Fig. 8
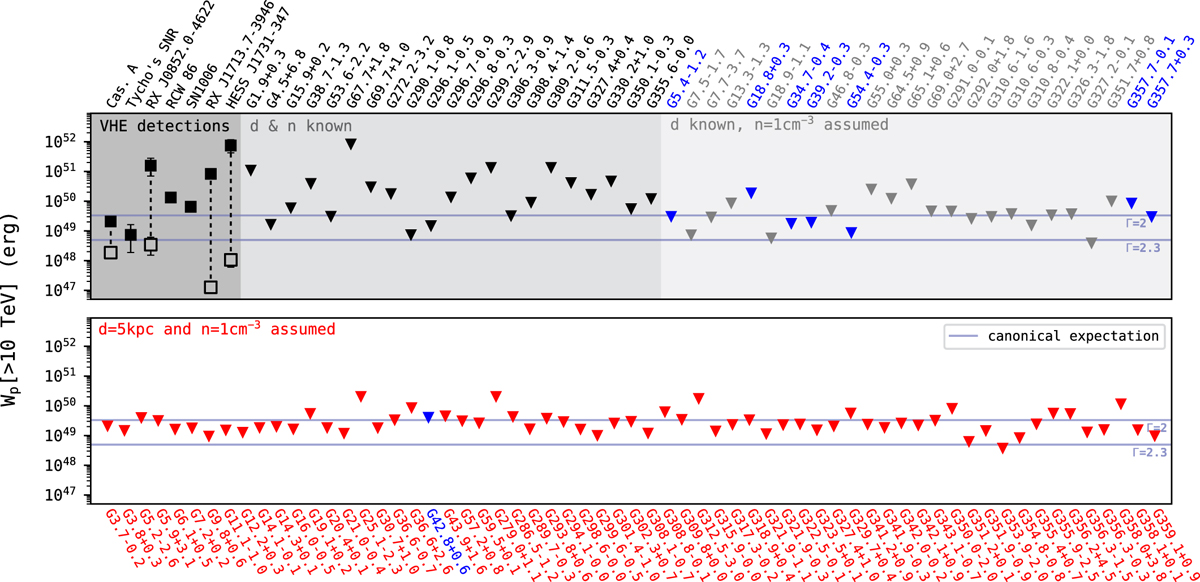
Sample of upper limits on the proton energy content above 10 TeV (triangles). Values are derived using the centre of the distance uncertainty interval. Blue triangles indicate SNRs that are likely to interact with molecular clouds (see Table A.1). Points are shown for the VHE-detected sample of SNRs, where the error arising from the distance uncertainty is indicated. In several sources a gas clump correlation of γ-ray emission was observed. In these cases, filled points indicate the result if the low density values in the rarefied inter-clump medium are used in the calculation, while open points show the result if the high density values inside the clumps are assumed.
Current usage metrics show cumulative count of Article Views (full-text article views including HTML views, PDF and ePub downloads, according to the available data) and Abstracts Views on Vision4Press platform.
Data correspond to usage on the plateform after 2015. The current usage metrics is available 48-96 hours after online publication and is updated daily on week days.
Initial download of the metrics may take a while.